


For over a hundred years, human resource management (HR), aswell as training (or learning and development (L&D) as we call it now), hasbeen more of an art than a science. Today, with better systems for measurementand computation, we are learning that those organizations that pay attention to“big data” and act on it compete more successfully. The same is true for HR andL&D: groups that can apply the science provide strategic contributions tobusiness success. This goes far beyond ROI measurements.
How can you measure the impact of L&D investments? Howcan you increase the results from the investments that succeed?
I interviewed Gene Pease, founder and CEO of Vestrics, aboutthese questions.
The evolution of human resources management
Bill Brandon: How does human capital managementrelate to human resources management? Are they the samething, or has something newbeen added?
Gene Pease: Humancapital management and human resources management are really the same thing. Theprofession has evolved to be more sophisticated than what we used to call just“human resources” or “HR.”
HR historically grew out of the support functions for payrolland keeping employees employed. Human capital management implies moresophistication, based on the body of work that’s been done over time indifferent fields in HR. That would include leadership development, recruitment,employee engagement, and so on. Now analytics is adding to that body of work, byusing the power of computers and applying the decades of study that have goneinto figuring out how to answer some complicated questions.
It seems to me that human resources management is nowevolving into human capital management because it is getting more strategic andhas a say in, hopefully, analyzing strategic decisions. The change is driven byour knowledge of things working and not working, and technology, and analytics.I think it’s all part and parcel.
BB: Are thereother drivers besides technology and analytics?
GP: Well, I thinkthere’s a lot of factors driving change. Market conditions are forcing change.The Boomers are retiring, the Millennials are coming up, and different approachesto learning, along with the use of technology, particularly wireless and mobile-deliverymechanisms, can provide content at the point of need. It’s economic conditions,with demographic changes, at least within US organizations—although the worldis not that much different to us, at least to what I understand from ademographic point of view. So I think there’s a lot of factors driving change.
Talent development and learning and development
BB: What’s the relationship between talentdevelopment and learning and development? Is there some kind of intersection oris there an area of overlap?
GP: There are multiple definitionsof these terms, and they absolutely overlap. Some people believe leadershipdevelopment would be under the umbrella of learning and development, whichcould be under the umbrella of the chief learning officer or a corporateuniversity. At the same time, other organizations say leadership development isunder talent development, not L&D and the corporate university. Now, itseems to me we’re trying to develop our talent, our human resources, both tomake them happy, be more productive, and stay longer, and to be more productivefor the organization and to get a return on the investment in people.
In my opinion, you’ve got to ask, “What investments are wemaking in the life cycles of our employees to develop them and how do we getsomething from the investment for the organization.” I think it’s both. When wedo analytics, we always look at the people impact. Does it help the groups ofpeople and the individuals on the job? Are they more engaged? Are weprogressing people in the organization? Then we always look at the impact ofthe investment on the organization’s strategic goals or on the optimization ofthat investment.
BB: The half-lifeof knowledge these days is said to be about two years, meaning that an engineercoming out of school with a bachelor’s or even a master’s degree, by the timethat engineer has found a job, half of what the engineer learned is outdated. Isn’tthat the reason for learning and development?
GP: We’re gettingsmarter at knowing that every person doesn’t respond the same way as everybodyelse to different things. To me, the whole idea is segmentation. When I speakabout this stuff, I talk about HR, or talent, or whatever group you want to assignthis work to, often pretty much spreading the peanut butter equally so theygive everybody the same onboarding program. Now we know that a single programprobably doesn’t work as well for everybody. Today we can begin to talk aboutsegmenting, so that, for example, different populations of people probablyshould get different flavors of the peanut butter in an onboarding program. Andyou can go down the line with all the investments we make in people throughouttheir life cycle and you can begin to segment or optimize those investments bybeing able to fine-tune them. That’s the power of what we know how to do today.
The continuum of analytics
BB: So let’s moveto the big question: What is human capital analytics? Is it related to return oninvestment (ROI)? Do we still need to calculate ROI? I’m looking at theContinuum of Analytics in DevelopingHuman Capital (Figure 1), and I also note that you and Jack Phillips werespeaking together at a recent conference. I wonder how your points of viewcompare and contrast?
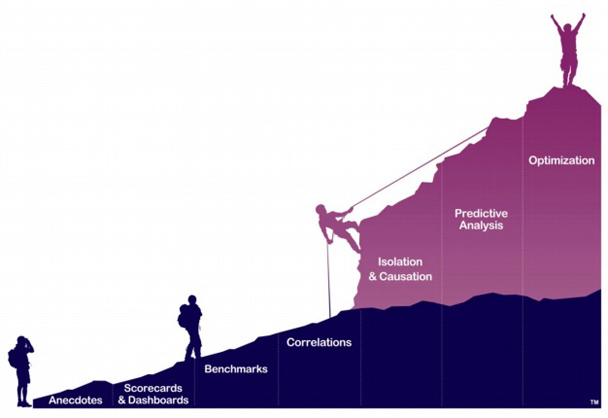
Figure 1: The Continuum of Analytics
(Source: Developing Human Capital.Used with permission.)
GP: Well, Jackand Patti and we at Vestrics are working on a series of initiatives andpartnerships. They believe (as I believe) that our work is complementary andadding onto the body of work that Jack has done. I’ve given up arguing that theinformation you see on dashboards is analytics. I don’t believe it is, but I’mnot going to argue with the industry any more.
The data that comes out of dashboards, the activity metricsof those departments, is the beginnings of analytics work. How many people tookcourses out of the LMS is important and is background information to data-mine.That’s where we start with data.
Getting to a business impact is part of that work. We must tryto identify the impact these investments have on the outcomes that we’re tryingto change, from a business point of view. What value can we put on thatfinancially?
ROI is just a calculation of the cost of an investmentversus the benefit. In other words, ROI is part of the continuum of doing thiswork. The exciting stuff, the stuff that we’re doing, is getting beyond thatand getting to really isolated business impact and ROI. This means you can thenunderstand where the investments are working and where they’re not. When you’vedone that, you can get into the world we live in, which is the predictable: weunderstand the relationship of all the different variables and the investmentswe made, and then we can, with high predictability, model the optimum ways tomake that investment, both from the people point of view and the organization’spoint of view.
As you move up the continuum, the work gets moresophisticated. We built the graphic of our continuum with a mountain becausethe analogy is, the higher you get, the harder the climbing is, but the betterthe view. And that’s really what is true with this work. That’s how we defineanalytics: it starts with the data coming out of the dashboards and you getmore sophisticated as you pull in data from other sources, and you do somesophisticated statistical analysis with that data.
BB: I have heardpeople say you no longer need to bother with ROI.
GP: You may not.Let me tell you why. Let’s say that you have an investment and you get all ofthe anecdotal and survey-based information back and it’s positive. You’vecalculated ROI a year ago on the same program—if it continues to show the samekind of evidence, then I wouldn’t calculate ROI again. I would say, okay, howdo we know, what have we learned to improve it? We’ve already proven theinvestment pays for itself, now let’s focus energy on making thoseimprovements. In that instance I would say you don’t have to recalculate ROI.But if a learning person says you don’t have to calculate ROI, then they’restill talking in HR-speak and they’re not talking the business of business.That’s part of HR’s problem. Historically, they haven’t spoken in the financialvocabulary often enough, so that the chief financial officer doesn’t give themas much credence as they should in understanding their business.
The measurement plan
BB: If a chieflearning officer or a director of training decided that he wanted to go thisroute, what should he or she include in the measurement plan for learning anddevelopment?
GP: First, youwould create a series of “filters.” That is, a series of criteria for theimportance of certain investments. They could be defined as “our largestinvestments” in training programs, from the largest on down. Or they could be accordingto corporate strategic importance. For example, sometimes leadershipdevelopment is not the most expensive investment an organization makes, but itmight be the most critical. So you set up a series of criteria, or filters, formaking decisions about how sophisticated you want to be and how much time youwant to spend in understanding the impact of these programs.
When you begin to rank those criteria according to requirementsfor your personal bandwidth and time investment, all of those variables, youthen begin to have a strategy for measurement.
Maybe some things are okay not to measure. For some trainingprograms, levels 1 and 2 survey data might be fine, because you have evidencethey’ve worked in the past. For the ones we’re going to allow using levels 1and 2 surveys on, we’ve already got some system in place that seems to work andthe data seems pretty accurate so we’ll leave them alone.
Then you want to move up, according to the way you definedthe continuum. We always recommend getting into some really sophisticatedmeasures, gaining real understanding, and making real improvements—those arethe most important for the largest investments or for the most strategicallyimportant. That sets the framework, what we call the “framework formeasurement.”
Depending on where you are in the framework, depending onthe tools you use, and the sophistication used for the measurement, you’ll havea very specific plan on where to measure and where not to, and on when to andwhen not to.
For the sophisticated work, we’ll have to figure out somethings. Do we have the internal resources, do we bring a consultant ortechnology in to help and to help teach us, or do we self-fund—build our owninternal analytic department? That becomes the investment decision.
A lot of the work we did in our early days, before we builta technology solution, involved coming in and doing initial process forcompanies. Now clients ask us to teach them how to do the work as they buildinternal departments to be able to do the sophisticated work. It’s a kind of anevolution once companies get started in this.
Analytics
BB: At what pointdoes predictive analytics come in? How does that work?
GP: Predictiveanalytics can involve determining strategy, and it can be used to improve theinvestments you’re making. When you’re making investments such as salestraining, in a large organization you may be training thousands of people. We’vemeasured programs that trained thirty thousand, fifty thousand people. You knowyou’re going to be investing in that sales organization, because the salespeople drive revenue and gross margin. How can we make sure, number one, thatthe training is working, but more importantly, how can you figure out how toimprove it? That’s where you do the really advanced stuff.
That’s not predicting a program, that’s optimizing theprogram you’re currently doing. It’s using the predictive capabilities ofanalytics to optimize your investments. That’s how I would refine predictiveanalytics versus optimization of an investment. One is the tool to get to theother.
BB: Can you givesome examples of organizations that have done this?
GP: I think wehave fourteen published case studies that are on our web site or in the books. (BB: See References at the end of thisarticle.) Most of them are with organizations you would know: ConAgra, SunMicrosystems, USBank, Chrysler. A lot of stuff in L&D and leadershiptraining—quite a few of them.
Alignment and optimization
Let’s go back to predictive analytics for a minute.
This is how we do alignment. [Figure 2] is how we view theworld, based on our framework and methodology. After eight or nine years ofconsulting, we’ve changed our vocabulary and you’ll notice we don’t use theword “KPI” [key performance indicator].
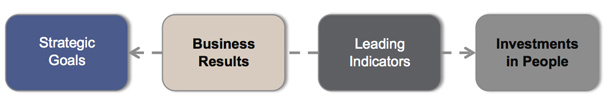
Figure 2: Measurement map
(Source: Developing Human Capital.Used with permission.)
We think about an investment in people and that could be anyof the things we’ve talked about—it could be a program, it could be anindividual curriculum, an individual course; it could be a process change likeperformance management; or it could be anything in L&D. We then identify theleading indicators, and those are the things you cannot put a financial value onbut that show proof you’re on the right path. You hypothesize by thinking aboutthese. And then we get to what business results we think we want to change orimpact, and does that tie into the strategic goals of the organization? And thestrategic part, a lot of HR or L&D people don’t have a clue what theircorporate strategic goals are. So we kind of force them to find out.
Figure 3 is a specific example of what we call “building thealignment.”
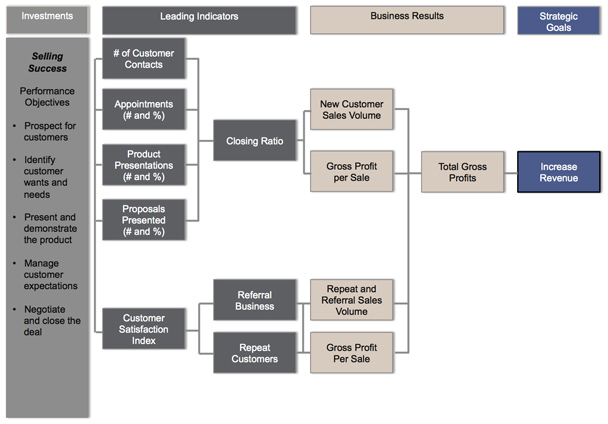
Figure 3: Alignment example for “Selling Success” course
(Source: DevelopingHuman Capital. Used with permission.)
Suppose we have a program called “Selling Success.” You seein the bullet points the goals of the program. We believe that if wesuccessfully deploy that program we might increase customer contacts, mightincrease appointments and presentations, and so on. If we increase any of those(which we define as leading indicators), the closing ratio may go up. I’mhypothesizing this is what this course is going to change. If my closing ratiogoes up, I will increase new-customer sales volume, gross profit per sale, andso on, and this increases gross profit, and that ties into strategic goals.
When we have organizations build these maps, just thinkingabout the alignment and having a framework that’s visual gives people much moreclarity. We have instructional designers who are using the lower end of oursoftware to build these maps. You can do it virtually, and then you can shareit. The beauty of doing it this way is that these boxes then define the study. Theytell you what data you need to start doing the statistics to identify whichvariables are affecting other variables.
This is what we call alignment. We give workshops in verysmall companies to teach people to think this way. In large companies you cando the advanced statistics and the predictive analytics. Now you really don’tneed to do the predictive analytics in order to get to alignment. The analyticsare just a very advanced statistical tool if you have a lot of data and youwant to get sophisticated and fine-tune your investments.
We think about this whole world of alignment in twodifferent chunks. We think about it first as setting up the alignment—how doyou build the map, what’s behind the map, what data I might need—and second,how do we use alignment in order to support either simple or very advancedanalysis of the data. We do the analysis to answer the following businessquestions: are my investments working, where are they working, and where arethey not working. Is my curriculum delivering—is that curriculum we designed tohopefully increase the closing ratio and so on, is it really doing that, or isit only affecting a few of those indicators and the people taking the coursearen’t getting the other three things the course was intended to deliver. That’swhat you can measure with this approach.
What next?
BB: Gene, isthere anything particularly important that you think the readers really shouldknow?
GP: We knowthrough at least a couple of different surveys that less than 7% of USorganizations of mid-size or larger have a dedicated analytics department withinL&D or talent, whichever term you use to define that broad umbrella. L&Dand talent groups have a huge opportunity to move quickly if they choose to. It’sthat other 93% that we have to encourage to do more advanced measurement of theactivity of the departments, beyond just pulling numbers and assumptions fromdashboards.
Get going! Start small and get going! Start building anexpertise! There’s a lot of information from studies on those enterprises thatare really, truly data driven that show they are out-performing theircompetitors. We know human capital is the most important asset a company hastoday, driving innovation and everything else.
We’ve got to get better at making those investments inpeople count. We can do more advanced work now. Ten years ago, when we starteddoing this work, it hadn’t been done before. Now the industry has a decade ofexperience. Some of us believe L&D (or talent) is where marketing was 10years ago. Think back 10 years ago, and then think what marketing is doing nowwith data. Unbelievable things. We could be doing the same thing in HR. That tome is the opportunity we all have.
References
Pease, Gene, Boyce Byerly, and Jac Fitz-enz. Human Capital Analytics: How to Harness thePotential of Your Organization’s Greatest Asset. Hoboken: John Wiley &Sons, 2013.
Pease, Gene, Bonnie Beresford, and Lew Walker. Developing Human Capital: Using Analytics toPlan and Optimize Your Learning and Development Investments. Hoboken: JohnWiley & Sons, 2014.