


Data & Analytics
Gauging the performance of learners—and of learning—using a variety of methods, information and approaches helps L&D improve learning solution design and development.
-

Canvas Career by Instructure: AI-Powered Skills LMS for Modern L&D
L&D teams have more opportunities than ever to build programs that directly connect with what learners need and what organizations are trying to achieve. The challenge is finding the time and capacity to do it well when content production, reporting, and administrative work fill most of the calendar. This demo shows how Canvas Career by Instructure, a skills-based LMS built for workforce learning, uses AI across the full workflow. We’re showcasing an end-to-end AI workflow that does the heavy lifting for you; from an AI Learning Assistant that personalizes engagement to an Authoring Agent that builds high-impact content from scratch.…
-
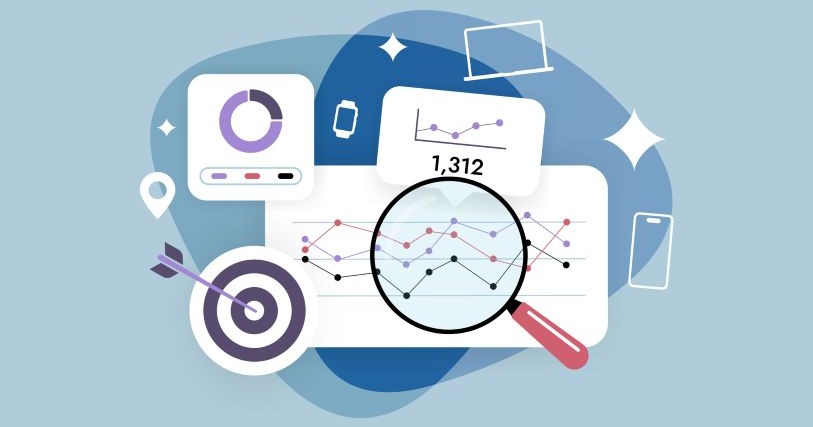
3 Questions to Address Before You Collect Any Data
When leadership asks for completion rates, [these three] questions help you respond with more than a number and more than they anticipated! This is where you, as a trusted advisor, begin to shine.
-

From B2C Engagement to B2B Outcomes
In the early days of a great learning program, magic often comes from one-to-one moments. There is real connection, relevance, and a clear link between learning and personal growth or career advancement. Engagement matters because it helps learners stay with the experience long enough to reach those outcomes. But as programs grow from serving individual learners to supporting learners within organizations, it becomes harder to hold onto what made them work in the first place. In this session, we will explore how learning organizations move from B2C learning models to B2B environments without losing effectiveness by grounding their approach in…
-
Speaking Data: The Language of Impact and Behavior Change
L&D teams often report data accurately from learning needs assessments, surveys, or evaluations. This is a good first step! Taking it to the next level is about turning data into actionable insights for stakeholders. This session reframes data as a language, moving from semantic reporting (what each survey question literally says) to pragmatic meaning (insights interpreted in context to drive behavior change). You’ll see how to use AI and pattern analysis to identify meaningful patterns in your mix of quantitative and qualitative data. These “experience patterns” can then be integrated into a strategic behavior-change approach, such as MOJO (Motivation, Opportunity,…
-
DevLearn 2026 Program Is Live: Explore What’s New
The DevLearn 2026 program is officially live—bringing with it an expanded, forward-thinking lineup designed to help learning professionals reimagine their learning strategies and drive real impact across their organizations. As North America’s largest learning technologies event, DevLearn continues to bring 200+ sessions, three powerful keynotes, and unmatched opportunities for hands-on learning and connection. But this year, the program features several exciting updates that reflect where the industry is heading and what professionals need right now. New track topics: expanding the learning landscape DevLearn 2026 introduces new track topics that reflect the growing scope of learning and development: These new additions join DevLearn’s comprehensive lineup of topic areas, all designed to help you stay ahead of change,…
-
Showing Value While You Build
Many L&D teams are expected to show value while programs are still being built, priorities are shifting, and resources are limited. This session focuses on how to communicate progress and impact during growth, not just after everything is complete. We will look at ways to talk about your L&D projects while they are still taking shape and how you can share early wins and progress in ways the leaders will trust. You’ll also learn how to set clear expectations with leaders during periods of change and communicate momentum without overselling results. We’ll explore practical examples and real scenarios, enabling you…
-
The L&D Metrics Hierarchy: Mapping Learning Data to Business Outcomes
Most L&D teams either track everything—or nothing at all. They collect dozens of metrics that don’t matter or rely on completion rates that say little to executives. In this hands-on session, I’ll introduce the L&D Metrics Hierarchy—a four-tiered framework developed to help Fortune 500 companies align learning metrics with business outcomes. As we explore each tier: Business Impact, Performance Outcomes, Learning Engagement, and Operational Efficiency, you will learn to use them to separate signal from noise. Together, we’ll learn to map your current metrics to strategic goals, uncover measurement gaps, and select the right visualizations to tell your story. You’ll…
-
Measuring What Matters: A Practical Starting Point for Learning Impact
Learning teams in every industry are under pressure to demonstrate impact, yet many struggle to move past completion and participation metrics without making measurement overly complicated. This session explores how AdventHealth prototyped a practical digital learning impact strategy using a 120-day baseline approach. Rather than pursuing perfect attribution, our approach focused on selecting a small set of meaningful metrics, establishing clear criteria for what to measure, and aligning learning to business priorities using existing, easy to gather data. This session will share the design decisions, assumptions tested, lessons learned, and how the approach evolved once theory met reality. You will…
-
Bring Your Data to Life with Dynamic Visual PowerPoint
Data is one of the core types of information you need to share with others, but in its raw form it can be anything but helpful. Often misleading, misinterpreted, or even irrelevant to the audience, data can be tricky to communicate effectively. In this session, you’ll see how to bring data to life. We’ll address strategies to use PowerPoint to approach data visualization and data storytelling based on your audience, your objective, the use case, and within any requirements set. You’ll explore techniques to create suitable graphs, charts, and diagrams that convey the key ideas in an elegant and memorable…
-

Baselines & Benchmarks: How Raw Data Becomes Actionable Insights
If your function uses an intake form, you’re sitting on more than a decision tool. You’re sitting on an amazing data source that, with analysis, becomes information you can act on.