


The Experience API (xAPI) and analytics complement each othernicely. You can use the xAPI to track any type of user/system interaction andthen use analytics tools to compile and interpret xAPI data. The interactionsyou track may result from learning systems and programs or from actual worksystems and processes.
Applying xAPI and analytics to measure learning and work outcomesenables you to go beyond front-end analysis to continuously analyze yourlearning and performance solution’s impact on business results. This approachenables you to adapt your learning and performance solutions in response to theever-changing needs and priorities of the business.
Following is a fictitious scenario illustrating a mission-criticalorganizational performance problem. We will explain how you can use adisciplined xAPI-driven analytics approach to address the problem.
The business challenge
Business is slow at Imaginary Widgets. In the past, that has oftenmeant budget cuts to the cost centers, including L&D. This time, the EVP ofsales is asking for help from the L&D Director.
Imaginary Widgets, which we will call IW, is a B2B company with sixmajor product lines. The life cycle for each product line is about eighteenmonths after which they redesign the entire line. The company staggers theprocess so that one product line is overhauled every quarter. While IW ispretty good at marketing, the EVP of sales thinks they are not preparing theirsales force well enough. Sales reps seem to be overwhelmed with the quarterlychanges and revenue is significantly below targets for the first three to sixmonths after introducing a product line update.
The L&D organization has had difficulty getting informationabout the product line changes far enough in advance to have their coursesready when the product is released. Once the courses are ready, it takes timeto get the entire sales force through all the material. L&D must find abetter way.
The front-end analysis
The L&D director assigns the problem to a team of her mosttalented instructional systems designers. The ISD team decides that a front-endanalysis is needed to learn more about the problem. They start by meeting witheach of the regional sales directors.
Several of the regional sales directors suspect that, for sometime after product launch, sales reps are facing increasing difficulty movingcustomers through the sales funnel, which has five stages: prospect, contact,in negotiation, offer, and close. The regional directors are not sure, however,at what stages customers are dropping out compared to more successful points inthe product life cycle.
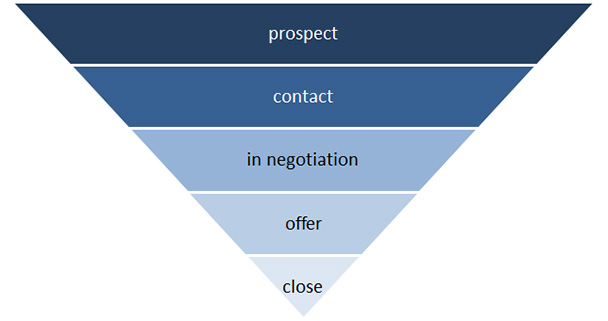
Figure 1: Imaginary Widgets’ sales funnel
Sales funnel states and revenue are tracked in IW’s customer relationshipmanagement (CRM) system. Looking at CRM reports, the ISD team confirms thatsales revenue drops significantly below target for three to six months aftereach product line update. The team also discovers that, during that timeperiod, there are far fewer prospects and contacts combined with a higherpercentage of dropouts after those funnel stages.
In an effort to identify the key challenges faced by salesrepresentatives during the first three to six months after each product lineupdate, the ISD team conducts several focus groups with sales managers.
Human performance issues contributing to the business challenge
The focus groups reveal two key performance issues:
- Key information needed to sell the updated products isextremely hard to find. This includes market research, competitor comparisons,product specifications, and collateral sales material.
- The product-line training takes too much time. The trainingitself is too long, costing valuable customer face-time. Many sales reps mustsell untrained for days or even weeks before they can complete the training.
Workarounds
Focus groups also reveal that managers try to assist their salesteams with a variety of workarounds, some of which are more effective thanothers. Two workarounds were used by the higher-performing sales teams:
- Some sales managers have informal relationships with productmanagers, whom they call for product information.
- One sales manager, whose high-performing sales team’srevenues are consistently higher, holds weekly team meetings to share productinformation and customer stories. Interestingly, the sales reps on the high-performingsales team spend less time researching and training and more time selling thansales reps in other teams.
Findings
Wrapping up the front-end analysis, the ISD team presents theirfindings and recommendations to the L&D Director. First, the analysisrevealed business problems, goals, and metrics (Table 1), which compriseddirect success measures.
Table 1: Direct success measures
Business problem | Goal | Business metric to track |
Revenue below targets for three to six months after launch of updated product line | Consistently meet or exceed revenue targets | Product line sales revenue tracked in CRM system |
Lower numbers of prospects and contacts in sales funnel for three to six months after launch of updated product line | Maintain consistent numbers of prospects and contacts through all 18 months of product life cycle | Sales funnel counts tracked in CRM system |
Higher percentage of customers dropping after prospect and contact stages for three to six months after launch of updated product line | Maintain consistently lower percentage of customers who drop after prospect and contact stages through all 18 months of product life cycle | Sales funnel counts tracked in CRM system |
Time is allocated less efficiently for most sales teams compared to the one high-performing sales team | Get other sales teams to use time efficiently like high-performing team does | Percentage of time spent in four categories (selling, researching, training, other activities) tracked in time-tracking system |
Recommended solution
Based on these findings, the ISD team recommends a learning andperformance ecosystem solution that includes three key components:
- A searchable product knowledge base where salesrepresentatives can find relevant information quickly. Product managers andmarketing experts will be responsible for publishing information the salesforce needs.
- Online access to product management experts that allowssales representatives to discuss product questions and issues.
- A formalized structure and guidance for sales managers toconduct the same types of weekly information-sharing meetings that seem to bemaking the high-performing sales team successful.
Each of the learning and performance solution components includesa set of ongoing questions to answer through xAPI activity tracking. Thequestions and activity tracking comprise indirect success measures (Table 2).
Table 2: Indirect success measures
Learning and performance solution component | Question to answer | Activity to track |
Searchable product knowledge base | What types of information are salespeople seeking and either finding or not finding? | • Sales rep searches where results were selected and accessed •Sales rep searches where results were not selected or accessed |
What types of information are salespeople using? | Sales rep consumption of information by: • Product (i.e., each product in the product line) • Type (i.e., market research, competitor comparisons, product specifications, sales collateral) | |
What types of information are being populated? | Product manager and marketing expert contributions by: • Product (i.e., each product in the product line) • Type (i.e., market research, competitor comparisons, product specifications, sales collateral) | |
Online access to product management experts | Which product management experts are sales people contacting? | Number of contacts per product manager |
Which product management experts are sales people getting the most value from? | Sales rep ratings of product manager interactions | |
Weekly sales team meetings | Which sales managers are conducting meetings? | Whether weekly meetings occurred per sales manager |
Are sales reps attending the meetings? | Number of sales reps in attendance |
The recommendations also include some sales representativeattributes that are thought to impact success (Table 3).
Table 3: Sales representative attributes
Question to answer | Profile data to track |
Does experience impact success? |
|
Do certifications and/or education impact success? |
|
How does the percentage of time spent on sales vs. research impact success? |
|
Need for analytics and the xAPI
Once implemented, the impact of the recommended learning andperformance solution must be continually evaluated, adjusted, refined, andimproved. Key to the success of this solution will be the application of xAPIand analytics.
Learning and performance activities (indirect success measures)and sales representative attributes will be tracked and compared with businessmetrics (direct success measures) using a dashboard. This approach will enableL&D to continue its analysis in a steady state and tweak the learning andperformance solution as needed while sales leadership monitors the solution’simpact on revenue.
To assemble the dashboard elements, you must define an overarchingxAPI tracking model. Before we review IW’s xAPI model, it is helpful to touchon how the xAPI works.
xAPI statements
The basic unit of communication in xAPI is the statement. The statement describes anexperience within a specific activity, which provides the foundation foranalytics. Statements rely on an actor-verb-object structure.
Take the statement:
Jack accessedthe /widget2Description
This statement indicates that Jack (actor) has accessed (verb)the product description for Widget2 (object). The xAPI statement isbuilt into the knowledge base system and is triggered by a specific action, inthis case Jack accessing a document. Once triggered, the statement generatesand stores tracking data to a learning record store (LRS). Later, analyticstools can be used to analyze all the xAPI data collected in the LRS.
So, with this in mind, the IW ISD team puts together an xAPItracking model for Imaginary Widgets.
The xAPI tracking model
The first step is to define the xAPI data we will use. Figure 2lists the direct and indirect success factors that the systems currentlyavailable to IW can measure.
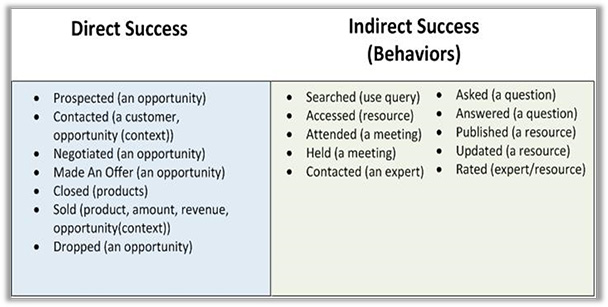
Figure 2: Success factorsto track
Verbs in xAPI provide meaning to what is going on within alearning experience. When applied to the overall context of sales, these verbsbecome powerful ways of storing and querying data. Each verb describes anactivity performed by a sales rep that results in a measure described in Tables1-3, above.
IW considers each customer engagement as a sales opportunity.There are verbs for each stage of the sales funnel in an opportunity, whichculminates (hopefully) with a close. Since sales of an individual product and productssold in a bundle are both important to track, two separate verbs are used—closed, which reflects all productsold in an opportunity, and sold,which is used to track each individual product. The verb, sold, retains the context of theopportunity, but is used to get more granular information on a single product.
Some of the data to analyze comes from a user profile rather thanan activity statement. To handle this type of static data, the xAPI includes aState API. You can update the State API as often as desired to storeinformation about a particular user. Figure 3 lists the data that the State APIwill track.
The xAPI allows hierarchies, dependencies, and other structuralcomponents, especially within activities. A robust xAPI model would make use ofthose capabilities, for instance to define higher-order activity types. For thesake of simplicity in this example, we will not get into these advancedstructures.
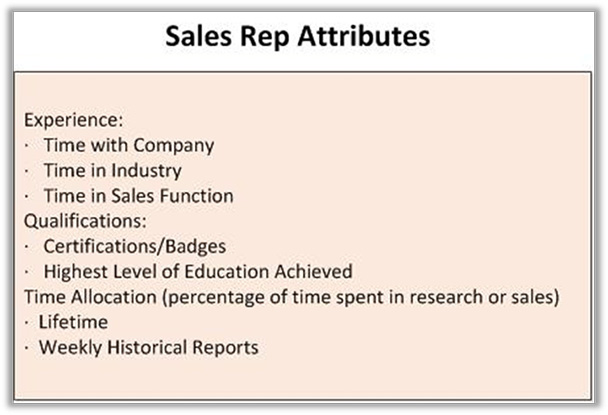
Figure 3: Sales repattributes in a user profile
The xAPI model helps the ISD team plan how data they are trackingwill feed the analytics dashboard. Direct success statements will producecounts, averages, percentage breakdowns, and measurements of the time it takesto progress through the various stages of the sales funnel. Indirect successstatements will produce counts of experts contacted, knowledge base contentpublished, and accessed. Indirect success statements will also identify thingslike search success rates, most-used resources and experts, most highly ratedresources and experts, and whether weekly sales team meetings are occurring.
The xAPI tracking model will enable analysts to dig deeper toidentify successful behaviors that drive high performing individuals andgroups. Some examples of these behaviors may include sets of multiple activitiesthat are more likely to result in sales success when performed in a specific combinationor sequence.
The sales representative attributes, which appear in the userprofile, will be available as optional filters for the direct and indirectsuccess data so that further analysis can be done on what makes a high-performingsales team or individual.
After defining the verbs to be used in xAPI statements, the ISDteam lists measures and maps relationships in a high-level diagram shown inFigure 4.
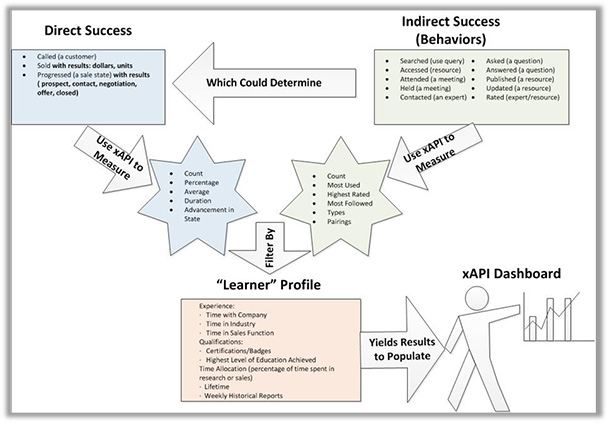
Figure 4: xAPI tracking model
Creating statements
Now that they have created the xAPI tracking model, the ISD teamis ready to define xAPI statements. Most of the statements generated withinthis learning and performance solution will be structured like the exampleshown in Figure 5, below, which shows a code example of the statement “SondraGreene accessed the Widget 565 Product Video.”
As far as the coding details go, the actor structure contains an agentdeclaration, the sales rep’s name (Sondra Greene), and the sales rep’semail address, which is used as a unique identifier, in this [email protected].
Next, a verb structure is used. The id is extremelyimportant because, when querying verbs in the system, the verb will separatethe activities. This company MUST use the same id for all resources accessed ifit wants to effectively capture them all with a single query argument. The displayis simply how that verb is shown on any sort of UI. Multiple languages areavailable, but only US English is shown here.
Finally, the object (activity if not declared otherwise),has an id corresponding to the resource (in a perfect implementation,the video would also be located at the id’sresolved URL:https://www.imaginarywidgetcompany.com/producttrainingvideos/sl1859f). You caninclude an optional definition as metadata. Although not required,inclusion of a definition is strongly recommended to provide more context forthe analytics.

Figure 5: Coding example1
For direct sales and other statements with a result object, take alook at Figure 6 below, which is the code for the statement “Sondra Greene soldone unit of Widget 17 for 10,000 USD as a part of sale widgetbuyer1021.” As youremember sold is used to identify an individual product sold as a partof a closed sale. xAPI uses context to identify the opportunity, namedwidgetbuyer1021, in which this particular sale took place.
The result portion is important for tracking outcomes ofstatements. While the verb part of the statement keeps track of an action, westill need a way to record whatever resulted from the action. The resultsection describes things we need to track resulting from the sold verb,including product ids, quantity sold, amount of revenue gained, and themonetary unit we are using.
Given that IW may implement additional future sales-relatedapplications of xAPI, it is important for the company to document its standardsand a common vocabulary for the sales-use model. IW has defined anenterprise-wide taxonomy in the form of an xAPI sales profile that contains theverbs and extensions (shown in Figure 6) that reflect a sale.
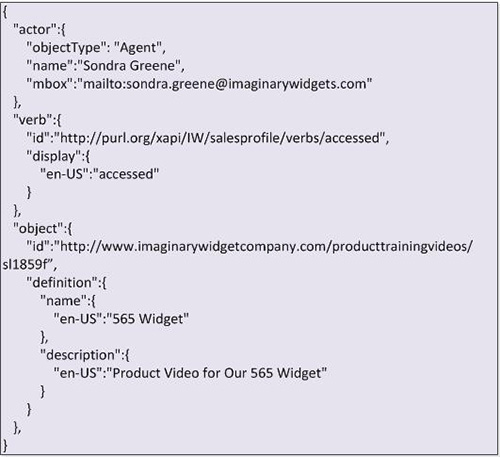
Figure 6: Coding example 2
Dashboard
Finally, the ISD team designs the analytics dashboard. Thegranularity of statements has made this relatively easy to do. They can run xAPIqueries on specific actor-verb-object combinations to produce the dashboard(Figure 7).

Figure 7: Analytics dashboard
Conclusion
Over the coming months, IW’s sales leadership will pay closeattention to the dashboard to determine whether sales revenue is improvingduring the first weeks of a quarterly product line update. L&D will bemonitoring the dashboard to determine which aspects of the learning andperformance solution seem to be having an impact.
The ISD team already has some ideas about how toexpand their use of xAPI to make the learning and performance solution evenmore impactful. They plan to introduce a “Did you know?” page where a sales repcan get personalized performance improvement tips like “Did you know that youare 40 percent more successful when you spend five minutes researching theproduct immediately before a call?” and other trends that are now possible toidentify through the xAPI and analytics. The team plans to clean up theknowledge base by archiving poor performing resources based on xAPI usage andrating data. They have also started to tag sales team meetings with product topicsthat were discussed to gain more insight into how these affect sales results.With so many possibilities, the application of xAPI and analytics to improvesales at IW has just begun.