


Cognitivism uses the metaphor ofthe mind as a computer: information comes in, is processed, and leads tocertain outcomes. Multiple cognitive learning theories describe three types ofmemory: sensory, working, and long-term.
Sensory memory momentarilyretains impressions of sensory information after the original stimulus hasceased. It refers the unprocessed information detected by the sensory receptorsand feeds it into working memory.
Working memory is whereperception takes place. The memory almost simultaneously assesses theinformation for high emotional recognition (Can it hurt or do I like it?) andrationality (Does it make sense?). As described by Wolfe (2001), working memory,“integrates current perceptual information with stored knowledge, and toconsciously manipulate the information (think about, talk about, and rehearseit) well enough to ensure its storage in long-term memory.” Information remainsin working memory for about 15-20 seconds unless acted upon (rehearsed).Working memory is like the Panama Canal of learning; the vast body of theWorld’s knowledge on one side, a veritable limitless amount of mental storagecapacity (long-term memory) on the other, and a narrow, limited gate inbetween. We call the capacity of working memory cognitive load, and it iscognitive load that is of concern to this study.
Long-term memory is memory thatcan last as little as a few days or as long as decades. It is theorized thatnew perceived information is more difficult to get into long-term memory than informationthat has some connection to previous knowledge. The value of “advancedorganizers” is accepted as a design strategy to aid in learning new informationby providing the lacking organization structure. A course map is a type ofadvanced organizer that shows the structure of the information to learn.
Suggested Further Research
Clark & Mayer (2008)suggested that what we don’t know about course navigation is “how navigationalelements, such as course maps and lesson menus, should be displayed. Is therean advantage to having them always visible, as in a left navigational display…” Further, Shapiro (2005) suggests “little work has focused on site map useamong more advanced learners …” It was the intent of this study to answer thequestions of whether or not displaying a course map continuously to advancedlearners will affect learning. We hypothesized several possible outcomes – thecontinuously visible map will supply or augment the necessary structure inlong-term memory and aid learning; the continuously visible map will add to theworking memory as an extraneous load and interfere with learning; or there maybe no appreciable affect.
Study Process
Method – Post-test-only Control Group Design
Prior Participant Knowledge
Because there is no generallyacknowledged definition for what is an advanced learner, for the purposes ofthis research, it means a learner with previous education or training in thesubject area that will provide a scaffold or schemata with which to perceiveand connect the newly presented information. For example, within the fall-protectiontraining topic, the concept of an anchor point (the point that a fall-arrest systemconnects to) has already been learned and used in practice.
As a prerequisite to completingthe study’s CBT training course, each learner has completed seven hours oftraining, successfully completed an examination, and demonstrated the abilityto apply what they learned during a practical exercise using various types offall protection equipment.
The Independent Variable
Employees that use personal fall-arrestsystems required additional training due to changes in the Hanford Site Fall ProtectionProgram. The training included new concepts, familiarization with a new permit,newly defined roles and responsibilities, equipment terminology, workedexamples of concept applications, application exercises with feedback, and aknowledge check.
The course was broken into five required sections with anoptional section containing subject-matter expert’s contact information and aknowledge check section. The only difference in the training content waswhether or not a course map appeared in the upper left hand cornerof each content screen (see Figures 1 and 2).
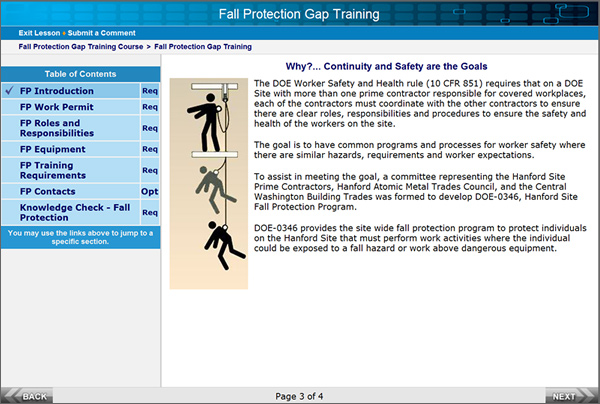
Figure 1. Site MapContinually Displayed on Screen
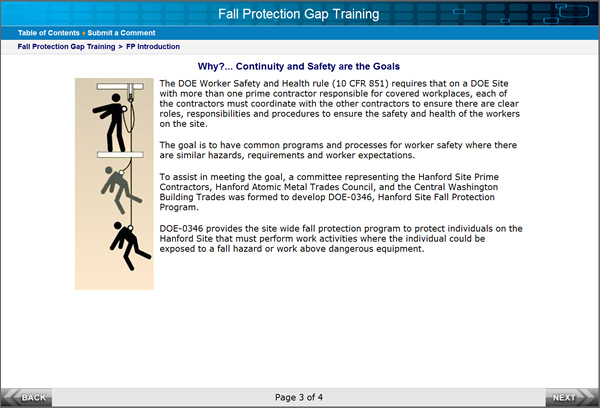
Figure 2. Screen Contentwithout Site Map
Dependent variables
After completing the fiverequired sections, the learners were required to complete a ten-questionknowledge check. We used the same ten questions for the post-test, although thequestions were asked in a random order. We used the learner’s performance onthe knowledge check as a dependent variable.
Time to complete the course was also tracked.
Randomness
We made the CBT training course availablevia an intranet. Learners could take the training at their own workstation orat a central location at a time of their choosing. Using a random numbergenerator, we assigned learners the screens containing the course map when itproduced an even integer. This created an experimental group that took thetraining with a course map continually visible.
We launched the course on July13, 2011, with data collected on 846 learners through September 23, 2011.During that period, 410 learners received the training with the course mapcontinually visible and 436 learners received the training with the course maphidden until a section was completed.
Course Content Presentation and Methodologies
Due to the variability of eLearningcourse design, I’m providing the following information and methodology descriptionsto aid you in being able to, at least to some degree, assess the quality of thetraining.
We based the overallinstructional design on the “Nine Events of Instruction” developed by RobertGagné, et al. (1992) and incorporated the “Multimedia Principles” advocated byClark & Mayer (2008A). We divided the fall-protection course into sixsections and a knowledge check.
Screen content began by applyingthe Signaling Principle (Atkinson & Mayer 2004) with a headline thatexplains the main idea of the screen content. Content may contain “hot words”that open a window containing a definition when the word is clicked, orhyperlinks to supporting documentation. The content included graphic organizersrepresenting organizational and process content as suggest by Clark & Mayer(2008B).
Application exercises wereincluded that required mathematical computations. We made a calculator availablevia a fly-out tab and provided feedback based on the learner’s input. Thefeedback to the learners’ correct answers applied the “Reflection Principle”(Colvin Clark, Ruth & Mayer R. E. 2008) by requiring learners to select anexplanation for why their response was correct (Figure 3).
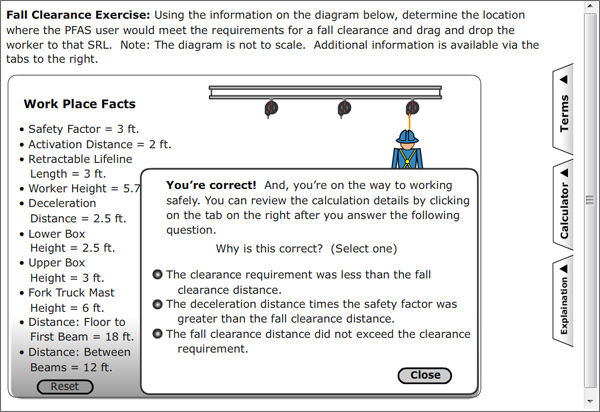
Figure 3.Calculation Exercise Demonstrating the Reflection Principle
Evaluation
We used aknowledge check to evaluate the learner’s mastery of the course content. Aknowledge check is different from a test in that each question’s answer isgraded individually and if found incorrect, the learner receives immediateremediation and must get the question correct prior to proceeding to the nextquestion. We only gather information regarding performance on knowledge checkquestions for each learner’s first attempt at a question. We developed knowledge-checkitems with an anticipated high degree of difficulty and discrimination. Forstatistical purposes, we graded the learner’s performance as a standard testusing the results for the first attempt for each of the ten questions that madeup the knowledge check.
Results
We calculated the means for both groups for the knowledgechecks and the time it took to complete the course (see Table 1), and thencompared the means and calculated a “t” value. The “t” result between the twogroups on time to complete the course is -0.64 and the “t” result for achievementon the knowledge check performance is -0.98. Both “t” results indicated nosignificant difference between completions times or content mastery.
Table 1.Calculation of Performance Means and t
| Navigation Displayed | Navigation Hidden | ||
n | 410 | 410 | 436 | 436 |
means | 1159.573 | 39.707 | 1164.766 | 40.986 |
sum (X ^ 2) | 1202262773 | 788000 | 1126432644 | 892900 |
(sum X)^2/n | 551290074.7 | 646435.1 | 591512463.9 | 732424.1 |
sum (x^2) | 650972698.3 | 141564.9 | 534920180.1 | 160475.9 |
df | 409 | 409 | 435 | 435 |
|
|
|
|
|
| Time to Complete Seconds | Achievement Score | ||
Pooled s^2 | 1405086.349 |
| 357.868 |
|
df | 844 |
| 844 |
|
s sub(X1-X2) | 81.546 |
| 1.301 |
|
t | -0.0636 |
| -0.9827 |
|
Conclusions and Discussion
The intent of conducting thisstudy was to help clarify some of the questions regarding the use of coursenavigational maps; how they should be displayed and how they affect theachievement of advanced learners. Based upon the results of this study, for theadvanced learner there is no significant difference in achievement whether youshow the course navigation continually or not, and no significant difference inthe amount of time to complete the course.
We mightattribute the lack of benefit from a continually visible course map to theexistence of advanced learners having a scaffold or schemata within long-termmemory that aided the learning of new information.
It is likelythe learners, after exposure to the continually visible course map began toignore it, and therefore it did not interfere with learning.
Since we found no significantdifference, what does this mean to designers of computer-based courses? Forcurrent courses, it means you should not use time and resources tonavigationally alter existing courses one way or the other for advancedlearners. For future course development and design, excluding a course mapwould allow the space it consumes to be used to enhance learning and not affectachievement or the amount of time to complete a course.
Consideration for FurtherResearch
One of the factors that affectour ability to recall information is time. All the learners in this study were exposedto the topic area via training or due to the nature of their work within twoyears of this study. There may be a point were learners will benefit from acourse map if enough time has transpired to allow the long-term memory supportto be forgotten. What we don’t know is at what point this may happen or how todetermine if it has.
References
Atkinson, C.& Mayer, R.E. (2004). Five ways toreduce PowerPoint overload. Creative Commons. https://www.sociablemedia.com/PDF/atkinson_mayer_powerpoint_4_23_04.pdf.Assessed March 2004.
Colvin Clark, R.& Mayer, R. E. (2008A). e-Learningand the Science of Instruction: Proven Guidelines for Consumers and Designersof Multimedia Learning, 2nd Ed. San Francisco: Pfeiffer.
Colvin Clark, R.& Mayer, R. E. (2008B). Learning by viewing versus learning by doing:Evidence-Based Guidelines for principled learning environments. Performance Improvement, 47 (9).
Gagne,R., Briggs, L., Wager, W. (1992). Principlesof instructional design (4th Ed.). Orlando, FL: HBJ.
Shapiro, A.(2005). The Site Map Principle in Multimedia Learning. In R. E. Mayer (Ed.) The Cambridge Handbook of MultimediaLearning (pp. 313-324). New York: Cambridge University Press.
Wolfe, P. (2001).Brain Matters: Translating Research intoClassroom Practice. Alexandria, Va.: Association for Supervision andCurriculum Development.