


Professor Jones is very excited to offer his first online course.He has carefully designed the learning material and quizzes that will help hisstudents grasp the content better for effective learning.
He assigns this five-week long course to his students and at theend of the second week, he starts feeling anxious about how his students aredoing in the class. He wonders:
- Do they understand the concepts well?
- Are they finding some concepts difficult tounderstand and spending more time on those screens?
- How are they doing on the quizzes?
- Are they finding the questions to be toodifficult or too easy?
- Are they completing the modules on time?
- Do they need any help to complete the course?
- Are some of the students at risk of failingthe course?
He has many questions, but nowhere to look for the answers. Althoughhis LMS provides details about course completion and quiz results, it’s nowhereclose to the ability he has in an instructor-led course in the classroom tomonitor student progress. Moreover, by the time he gets the information fromthe LMS, it’s too late for any corrective action.
The learning analytics dashboard
To fill this gap, Adobe Presenter 9 offers a learning analytics dashboardthat empowers instructors with the ability to detect potential learning problemsand to intervene early—improving the chances for students to meet and evenexceed their expectations.
Dr. Jones thought of giving it a spin and registered his eLearningcourse for reporting. When he first logged into the dashboard, he reached theoverview page (Figure 1), where he could evaluate his class performance, as it gavehim the information about the percentage of students who had completed thecourse and those who were still in progress. The most important piece ofinformation for him was the number of students who needed intervention and thenumber of students who had not even enrolled for the class. He was also happyto see an overview of module-wise progress in the class and overall activity inthe class, in terms of time spent and number of students actively participatingin the class.
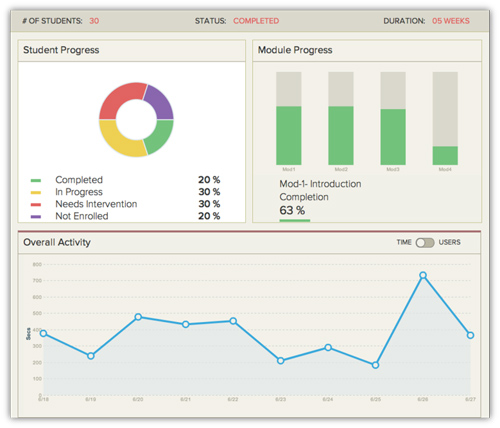
Figure 1: Course overview
Drilling down with the dashboard
After viewing this data, he clicked on the student progress chart,and it took him directly to the All Students view (Figure 2), where he couldcheck out the progress of each student based on his or her module completion,quiz score, and class participation.
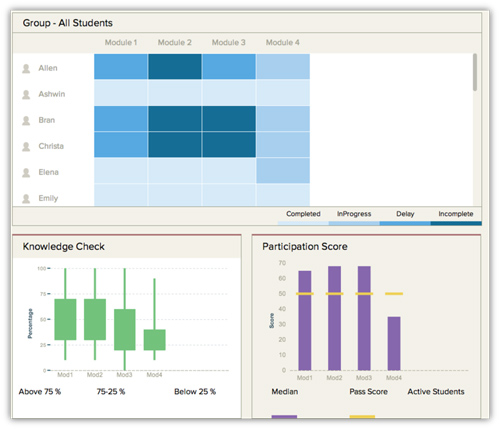
Figure 2: Report for allstudents enrolled for the class
Professor Jones had enabled in-course collaboration for hiseLearning course, which allowed his students to ask him questions—and tocommunicate with their peers, as well. This also provided a channel to thestudents to answer questions, and to follow questions that interested them sothat they receive notifications when there’s any new activity on that thread.They were also able to like or dislike an answer posted by their peers. Dr.Jones made collaboration mandatory for his students by assigning a participationscore to it. This helped him foster collaboration skills in his students. Hegave the students incentive to do this, in form of marks he eventually added totheir final course scores.
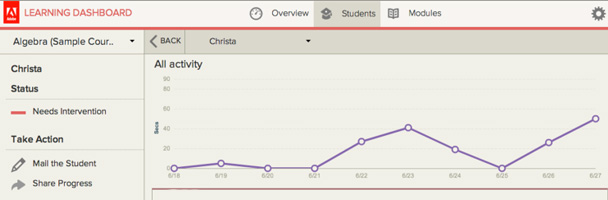
In the All Students view (refer back to Figure 2), he could see howall his students were progressing in the class. This view depicted modulecompletion in the form of a heat map, and this allowed him to easily find outwhich students had completed the modules in time, completed with a delay, leftincomplete, or were still in progress. Professor Jones was also able to digdeep and find more about a student’s performance in the class by just clickingon the student name in the All Students view. This feature gave him a detailedactivity report on the student (Figure 3), the student’s quiz score as comparedto the class, and the student’s participation score. He was also able to get amodule-wise report to investigate the problem areas for the student in order toprovide her with some remedial teaching. Dr. Jones was delighted to see that hecould share the feedback or remedial teaching material in an email from withinthe learning dashboard and include a screenshot of the progress report.

Figure 3: Individual StudentView page
Professor Jones was also able to generate agroup-wise report (Figure 4) to see which students had completed the course, werein progress, or most importantly, the students who needed some help to completethe course. He was able to send a common email to them or share their progress status.
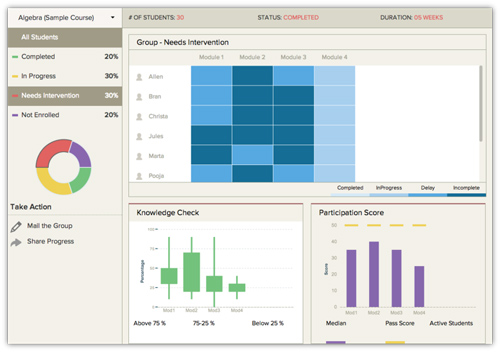
Figure 4: Group-wise report
Improving course quality
This dashboard also allowed him to check the health of his courseby showing him the details about which were the most- or least-visited coursescreens and on which screens the students spent most or least time (Figure 5). Anotherdashboard option gave him a detailed report of the questions answered correctlyby all or by none of the students. With this data, he was able to identify the extremelyeasy and extremely difficult questions that he could eliminate from the quiz,as these questions failed to discriminate among the students.
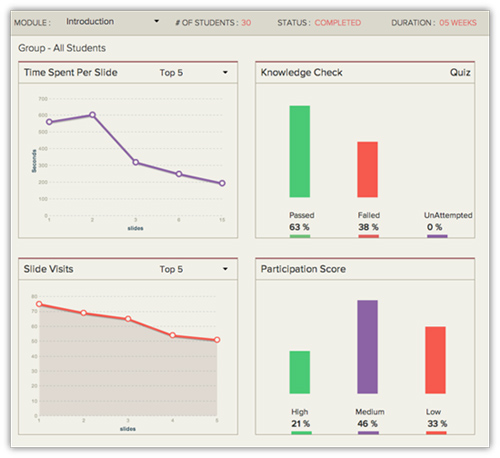
Figure 5: Module-wise report
Dr. Jones found these reports just right to gauge the performanceof his students and provide them timely assistance to complete the coursesuccessfully. He felt that he had better control on his online courses and knewexactly how his students were performing in the class. He could track lowperformers and intervene early to help the students bridge their learning gapsand prepare them to learn the next set of concepts along with the other students.
Make learning analytics work for you
Learning analytics features in Adobe Presenter 9make it possible to monitor learning performance from the course level all theway down to the individual learner. The designer can identify details of thecourse for improvement. The instructor or course administrator can drill downto look at significant aspects of learner engagement and detect whereindividuals may be experiencing difficulty. These capabilities represent the potentialto make important enhancements to design and delivery of instructional content.Designers and instructors who make good use of learning analytics will improvethe results of courseware use on an ongoing basis.