


Big data is an increasingly significant presence ineLearning circles as more managers turn to learning analytics to improveresults. What can big data teach eLearning professionals and managers? How cananalytics data be used to improve results? And what does it mean to improveresults, anyhow?
Learning Solutions Magazine will explore the arena oflearning analytics from multiple angles as it seeks answers to these and otherquestions. This article provides an overview of what is meant by learninganalytics, how eLearning developers can use them, and how the data are oftenmisunderstood.
Learning analytics and the LMS
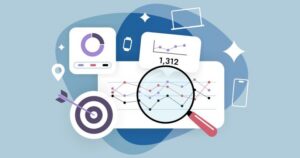
A learning management system, or LMS, is the source of muchdata about eLearning and learners. The LMS can tell managers who is completingeLearning, how long each learner is spending, what their test scores are, andhow they rated the course. In other words, an LMS is a good source of quantitativedata about any aspect of learning that occurs within the LMS.
Managers can analyze this data to identify which employeesare struggling and might need additional training; they can also identifylearners who have successfully completed learning materials and might be readyfor new challenges. Thus the data can help managers make predictions and tailortraining to learners’ needs.
Studying data gleaned from learner evaluations or “smilesheets” can help managers and instructional designers improve eLearning byflagging what learners like and dislike. Similarly, data about engagement—howlong learners spend with eLearning content—can drive improvements in thequality of the materials.
But learning analytics can provide much more.
Beyond the numbers
In her TED talk on big data, Susan Etlinger says, “We have to ask questions, and hard questions, tomove past counting things to understanding them.” What does that mean foreLearning professionals?
Understanding numbersand data requires context. It requires information about how learners are usingand applying facts and techniques studied in the eLearning module. That alearner successfully answered 90 percent of the quiz questions at the end of amodule is meaningless unless the learner somehow takes that information anduses it to perform better on the job—to solve a problem, to communicate betterwith a direct report, or to provide a higher level of customer service, forexample.
Looking at an entirelearning ecosystem—learning and experiences that occur in the LMS are only onesmall piece of that ecosystem—can provide the data on experiences and behaviorthat create that context.
Some eLearningprofessionals suggest that the key is what? More data.
One approach is usingxAPI statements to gather data from all sorts of learner activities, not onlywhat happens inside the LMS. Learning Solutions Magazine will explorethis possibility in a future article.
Another approach is toapply human ingenuity to analyzing the numbers by asking tough questions andchallenging assumptions about those numbers. Etlinger, in the TED talk, sharesa personal experience that underlines the importance of looking beyond key metricsand numbers. Her son was diagnosed with autism at age two, after failing tomeet certain developmental metrics dealing with communication. These metricslooked at the number of words and communicative gestures he used; he was evaluatedas communicating at the level of a nine-month-old baby. However, when her sonwas not quite four years old, Etlinger found him in front of the computer,running a series of Google searches. He’d somehow taught himself to read, type(with misspellings), use Google—and communicate.
“This is what happenswhen assessments and analytics overvalue one metric—in this case,verbal communication—and undervalue others, such as creative problem-solving,”Etlinger said in the talk. “Communication was hard for Isaac, andso he found a workaround to find out what he needed to know. Andwhen you think about it, it makes a lot of sense, becauseforming a question is a really complex process, buthe could get himself a lot of the way there byputting a word in a search box.”
Getting started
It’s easy to be overwhelmed by the amount of data availableand the number of ways to analyze and use that data. Don’t worry; there’s help:
- The eLearning Guild published a white paper inDecember 2016, Learning Analytics: A Practical Pathway to Success, that outlines a six-step process to gathering, analyzing, andapplying data on learners’ activities.
- Several sessions at Learning Solutions 2017 Conference & Expo (March 22 – 24 in Orlando, Florida) willaddress using analytics for performance support and improving employeeexperience. In fact, there are more than a dozen sessions on the subject in theData and Measurement Track.