


In September 2016, The eLearning Guild presented an online Data& Analytics Summit for Guild members worldwide and other interestedpractitioners. During the two-day event, thought leaders from the data andanalytics space explored questions that those in the learning field arestruggling to answer. The speakers helped provide clarity around whatpractitioners are doing today and what they can accomplish in the future withlearning analytics.
Our newest white paper, by leading analytics expert and assessment practitioner A.D.Detrick with Sharon Vipond, provides timely information and guidance thatsupports and extends the ongoing goals we envisioned in the Data &Analytics Summit. This white paper providespractical insights meant to help you make data more actionable within yourorganization, and to prepare you to take advantage of the new opportunitiesthat data will open up for learning in the future. In this valuable white paper,you will learn about:
- Four types of analytics that are used todescribe and distinguish complex data categories
- Six steps that form the learning analyticsprocess
- The importance of creating a clear andcomprehensive data impact map beforebeginning data capture
- Four types of learning analytics that define thebasic metrics underlying learning interventions
- Statistical analysis methodologies recommendedfor learning analytics processes
- The importance of providing an analyticalcontext that helps inform stakeholders of strategic insights contained in dataresults
- How to avoid common learning analytics pitfalls
- How to use a checklist of “Steps to Success” inlearning analytics (this checklist is included with the complete white paper)
Also included are extensive resources from The eLearning Guildand other sources, as well as a glossary of terms, which helps define theterminology discussed within the paper. Let’s now review some of the basicconcepts and practical advice presented in the white paper.
The rise of learning analytics
Fordecades, the learning industry has operated under a simple guiding principle—toprovide relevant, applicable, and timely learning. And for much of that time,the industry has measured and refined its efforts with a loose collection ofhigh-level data points. Learning management system (LMS) completion records,satisfaction surveys, and test results have been aggregated and compared totrack historical performance. Having access to only broad, high-level datalimited the industry’s potential for any insightful analytics, and so learningand development (L&D) stakeholders adjusted their expectations accordingly.But the desire always remained to make learning more relevant, more applicable,and deliver it just in time—a truly personalized learning experience.
Soonafter the turn of the century, a massive explosion of digitization and globalinformation storage occurred, and it has continued to grow unabated. Theability to gather and store data efficiently and inexpensively has made largedata warehouses a standard investment, often created without any specific planfor how the data will be used. Distributed tech platforms and cloud-basedstorage of data have made the storage, transfer, and computation of massiveamounts of data possible by individual users, not just super-computer owners orbusiness analysts with detailed knowledge of writing SQL queries. And for thefirst time in history, L&D (and industries like it) began to see vastincreases in learner data: data that could be used to provide insights intolearner behavior.
Moreimportantly, we began to gain access to business data: sales numbers,productivity metrics, customer satisfaction scores, etc. Business data, oncesiloed and guarded with fierce territoriality, suddenly expanded so rapidlythat data sharing became a more respected commodity than data hoarding. Wheneveryone became a data owner, the need to protect data for the few insights itcould yield disappeared. Now, owners could share their data freely to searchfor meaningful insights in the way different behaviors affected one another.
L&Ddata owners are no different. In recent years, our access to data has expandeddramatically. No longer are we relegated to an LMS-provided list of coursecompletions per student as the sum total of our efforts. Today, L&Dorganizations receive data from numerous sources, often in great detail.
- Traditional LMSs have expanded their data-gatheringcapabilities to include data on user behaviors within courses, as well asdetailed information on assessments and surveys administered within the LMS.Many include social collaboration functions that can be tracked closely.
- The rise in Experience API (xAPI) learning record stores(LRSs) allows L&D organizations to not only track any designated learningactivity, but also import data from relevant business sources.
- Learning portals and corporate MOOCs now track asynchronous, self-guidedlearning through microcontent andcurated content, where learners can learn through millions of possiblepermutations.
Ina few short years, data has become so available to L&D that we can not onlyquantify our learning efforts, but now also perform analytics that identifywhich aspects of learning correlate most strongly with employee performance.Finally, the availability of data—and the reduced uncertainty provided byeffective learning analytics—allows L&D departments to create timely,applicable, and relevant learning.
Four types of analytics
The first major step in a learninganalytics initiative is the gathering of data—and the more data, the better.However, raw data itself is useless; it is just a bunch of individual pieces ofinformation that need to be aggregated and compared before we can pull insightsfrom it.
But just gathering data randomly, with no forethought or plan, is an unwisestart. The goal of any analytics initiative is to identify decisions that willlead to impactful actions. Effective planning will help define which type(s) ofanalytics you can perform, what questions you will be able to answer, and howmuch additional input you will need in order to make insightful decisions. In2014, Gartner definedfour categories of analytics: descriptive, diagnostic, predictive, andprescriptive. Each of these four categories (Figure 1) provides insight intothe raw data; as the complexity of the analysis increases, less additionalinput is needed.
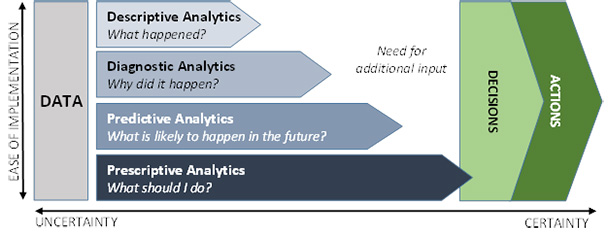
Figure 1: The four categories of analytics (Source: Gartner,2014)
Descriptive analytics
The simplest, and most basic, form ofanalytics is descriptive analytics.Descriptive analytics use historical data to tell us what has happened. Theseanalytics usually require the least amount of mathematics to define; an analystusually needs to know only how to sum or average a set of numbers.
Common descriptive analytics in L&Dinclude count of learners, number of classes completed, and average scores onan assessment. Descriptive analytics provide a hindsight view of ourperformance. Unfortunately, it is a hindsight view without the benefit of anycontext, which makes it pretty useless. Without context, it is impossible toknow whether our L&D department’s holding 29 classes last week was typical,excessive, or underperforming. And yet, because descriptive analytics are soeasy to gather and assemble, many reports in the L&D industry don’t gobeyond descriptive analytics.
Diagnostic analytics
Diagnosticanalytics provide the context needed in descriptive analytics. Whereasdescriptive analytics is concerned with the count or average of a data set,diagnostic analytics is focused on identifying the significance of those eventsand where they stand in relation to similar events. This context can helporganizations identify what hashappened, and it can also provide evidence for us to understand why it happened.
Diagnostic analytics require more effort tocomplete. The common functions of diagnostic analytics are the distributions ofoutcomes, probabilities, and statistical likelihoods. Building on the workwe’ve done in descriptive analytics, we can use diagnostic methodologies tofind answers to more relevant questions, such as “Which trainer(s) outperformedtheir peers on the course?” or “Which location(s) had the highest coursecompletion rates last week?” Diagnostic analysis can tell us what happened, andwhere that metric stands in relation to other metrics and the significance ofthat difference.
Predictive analytics
While the previous types of analytics werefocused on what has already happened (and why), predictive analytics is focused on what is likely to happen. In thesimplest terms, predictive analytics is using previous conditions to makeeducated assumptions about what is likely to occur in the future. Withpredictive analytics, we make hypotheses (assumptions) based on sets ofquantitative data and how these sets interact with and affect one another.These hypotheses are tested using statistical tests that identify when therelationships between behaviors in different data sets are likely to affect oneanother. These behaviors are then characterized as “predictive.” Predictivemodels also include a value that identifies the level of certainty of theprediction; it is important to remember that no analytics can predict with 100percent certainty, but every statistical test has a threshold that tells uswhen there is enough statistical evidence to consider the prediction“significant.”
Common examples of predictive analytics used by L&Dorganizations include regression models, classification models, and Bayesiananalyses. These examples require some advanced analytics tests to completethem: t-statistics, AIC (Akaike information criterion), confidence intervals, KS (Kolmogorov-Smirnov)test statistics, p-values, etc. While these tests can all be calculatedmanually, they are made much easier by available business intelligence (BI)tools, many of which will not only calculate these models but also translatethem into plain language.
Prescriptive analytics
Prescriptiveanalytics is the extension of predictive analytics. If predictive analyticstells us what is likely to happen by finding relationships in the data withvery little uncertainty, prescriptive analytics finds the most significant ofthose events and recommends automated future actions. Prescriptive analyticstakes the detailed statistical work of the predictive models and providesguidance around discrete decisions that can be made to ensure positive results.
Say, for example, your prescriptiveanalytics tested whether learners who viewed at least 10 instructional videoson a learning portal are more likely to achieve higher customer satisfactionscores in the first 90 days. Predictive analysis would find out how likely thatis to occur. If the predictive model is able to reduce uncertainty enough, theprescriptive analytics make the decision for us: All learners must watch atleast 10 videos on the learning portal.
This is a fairly discrete, simple example. But many of themodern BI tools offer highly sophisticated algorithms (such as neural networks) to locate and characterize these relationships.
The learning analytics process
Performinglearning analytics is often confused with data mining, in which analysts querylarge data sets for trends and common themes that may yield insight. While datamining is effective in specific situations, most L&D departments do nothave the volume and depth of data on their own to mine for valuable insight.Instead, learning analytics is a process that benefits from advance planning.
Our newest white paper describes thelearning analytics process as consisting of the six phases shown in Figure 2and further explained in Table 1.
![]()
Figure 2: The learning analytics process flow(Source: A.D. Detrick, 2016)
Process Stage | Description |
Hypotheses/Assumptions | Identify the business goals and measurable objectives of the analytics effort, and map how they will affect one another. |
Capture and Clean Data | Capture the data by different data sources. Clean and normalize those data so they are prepared for proper analysis. |
Analyze and Report | Perform the proper analysis, and report the findings to relevant stakeholders. |
Use the Findings | Ensure the data are presented in such a way that the report will be received properly by the recipient and action will be taken. |
Refine Offerings | Update L&D offerings based on analysis. |
Build Supporting Content | Create supporting content to reinforce the learning. Ensure that content correlates strongly with impact and fills any missing content gaps. |
Table 1: Six phases within the learninganalytics process (Source: A.D. Detrick, 2016)
Conclusion
The exponential increase in available data may have been thewellspring that created the opportunities of learning analytics, but itsadoption and growth can be attributed to how well it helps define our impact.There is an old adage about analytics that states, “It’s not about thedata—it’s what you do with it.” In previous years and earlier L&Dincarnations, practitioners could define their usefulness through limited data:the number of classes completed, the number of people trained, and—onoccasion—qualitative responses and assessment scores. But the connectionbetween their efforts and the intended results of those efforts was alwaystenuous, at best. Now, with proper planning and execution, practitioners haveaccess to insights that identify how effectively their efforts have helpedtransform the organization. They can identify which elements of L&D havesignificant impact—and which don’t. All of this information can (and should) beused in designing strategies to continually optimize performance by identifyingand promoting the elements of L&D that provide the most impact.
That capability should also speak to the heart of all learningleaders. For decades, L&D has tried to distill our available data intosimple numbers, to find a calculation that could clarify whether or not ourefforts were worthwhile. Learning analytics not only provides this opportunity,it provides it at increasingly more granular levels than we had ever imagined.Today, learning leaders have the opportunity to sit down with organizationalstakeholders and provide detailed analyses of which L&D efforts correlatewith impact and which don’t. More specifically, learning leaders enter thosediscussions armed with data to show how L&D has helped engineer behavioralchange, and they can then lead discussions with other influencers whose effortsmay have had different effects. Instead of taking on the entire burden ofbehavioral change, learning leaders can use learning analytics to show howlearning is creating an impact and to ask other areas (IT, HR, recruiting,front-line management, etc.) to show how their efforts are having complementaryor conflicting results.
While learning analytics can, at times, require complexmathematics and assistance from software to complete, the majority of learninganalytics work exists in a basic framework that most L&D professionals canmanage. Following the framework provided in this white paper can help create afoundation for these efforts, which will allow L&D departments tocontinually refine and optimize their efforts for greater and greater impact ontheir organizations.
References
Bosomworth, Danyl. “Micro content – what is itand how to leverage it.” Smart Insights. 23 March 2014.
https://www.smartinsights.com/digital-marketing-strategy/micro-content-strategy/
Gartner. “Gartner Says Advanced Analytics Is aTop Business Priority.” 21 October 2014.
https://www.gartner.com/newsroom/id/2881218
University of Wisconsin–Madison. “A BasicIntroduction To Neural Networks.”
https://pages.cs.wisc.edu/~bolo/shipyard/neural/local.html
https://www.elearningguild.com/insights/index.cfm?id=186&utm_campaign=wp-mooc1505&utm_medium=link&utm_source=lsmag