


Learning analytics are rapidly gaining interest and organizers are creating specialized conferences to dig deeper into the subject (e.g., learning analytics and knowledge). Learning analytics is an umbrella term for a variety of ways to analyze what happens in a course.
- Massive Open Online Courses: Setting Up
- Choose and Embed Social Media in Your MOOC
- Build a Dashboard for your MOOC
- Make Your Cloud/MOOC Course BYOD Friendly
- Adding Learning Analytics to Your Open Online Cloud Course or MOOC
- Ten Tips: Keep Learners Motivated in Your Open Online Cloud Course or MOOC
What are learning analytics?
There are three important sets of learner analytics:
- The number-driven statistics: time spent on a certain piece of content or the amount of hits generated per content feature
- The social network analysis (SNA): looks at the interactions between learners and facilitators, and identifies which learners are key participants with links to a lot of other participants (motivation)
- Quality analysis: looks at the quality of interactions, although this demands a much more elaborate set of rules and algorithms
Why are learning analytics important?
As technology becomes more and more semantic, learning analytics will feel more natural to all. This brings along a lot of future benefits for the facilitator or trainer:
- Clear indicators to enhance course content. Analytics can point to content that is not understood or is difficult to comprehend (people return more frequently or spend much more time than expected). This allows facilitators to go in and ask how that piece of content can be improved.
- Pinpointing learners at the verge of dropping out: decreased participation, emotional language used in shared content. All of these can be indicators of future dropouts. Proactively engaging those learners again might give them renewed energy.
- There are also benefits for the learner:
- It helps learners meaningfully filter web content: just imagine that as you learn and you pick up content from the Web or from courses, a learning algorithm locates other content directly related to your interest. This saves time and increases your expertise.
- It delivers meaningful support: showing weaknesses in your knowledge.
- It helps you connect to parallel or complementary learner colleagues.
- It offers guidance for correct participation/quotation/certification.
Tools for learning analytics
The number of learning analytics software tools is growing, but there are still a lot of challenges: security, standards (to be able to filter content across multiple software and hardware options), the semantic web is only just starting (theory looks great, but practical implementation is tough), lack of human understanding of the act of learning in all its fields (neuroscience and cognitive science).
There is a convenient list of tools and links to them on the LAK11 Tools wiki. In addition, here are some of the existing tools for learner analysis or sociograms:
- Cytoscape: http://www.cytoscape.org/
- Netminer: http://www.netminer.com/sub01/sub02.php
- Touchgraph: http://www.touchgraph.com/navigator
- Piwik (open source analytics): http://piwik.org/
- Statsmix: http://www.statsmix.com/
Getting started
It is better to start simple and get an understanding of how learning analytics works.
The simplest learning analytics are those that count the hits and time spent on certain content pages. So let’s take a look at how you can set this up using the free Google Analytics software, which is also available for mobiles.
First, create a Google Analytics account: username, password … the usual. After that, point Google Analytics to the different URLs you want to analyze: choose admin, add a new account (Figure 1).
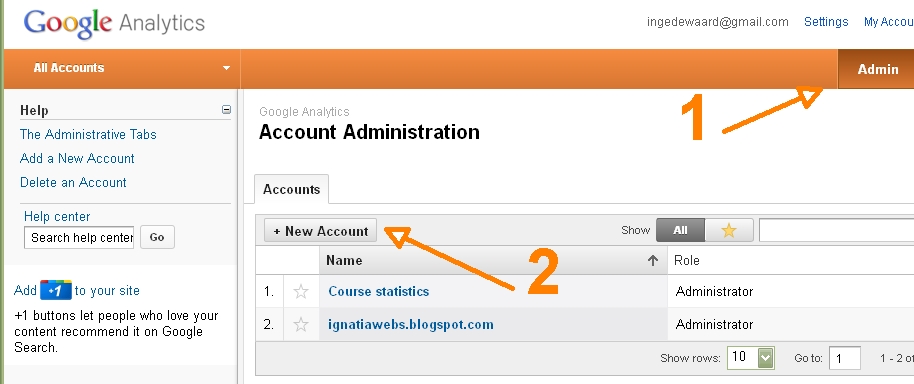
Figure 1: Setting up Google Analytics
Now, type in all the properties (the course URLs you want to track) (Figure 2).
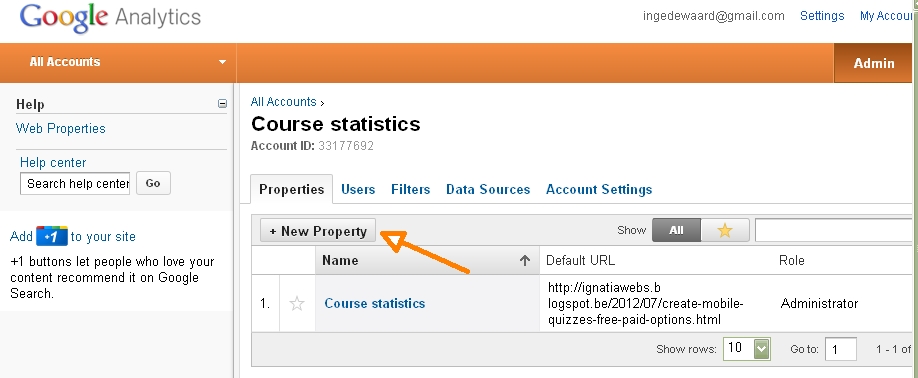
Figure 2: Setting up course tracking
After that you let the software to do the basic work: e.g., understanding which browsers they use to connect to the content allows you to improve device delivery, or which international learners spent the most time reading. Figure 3 shows how you can identify where your learners are and how much time they spent.
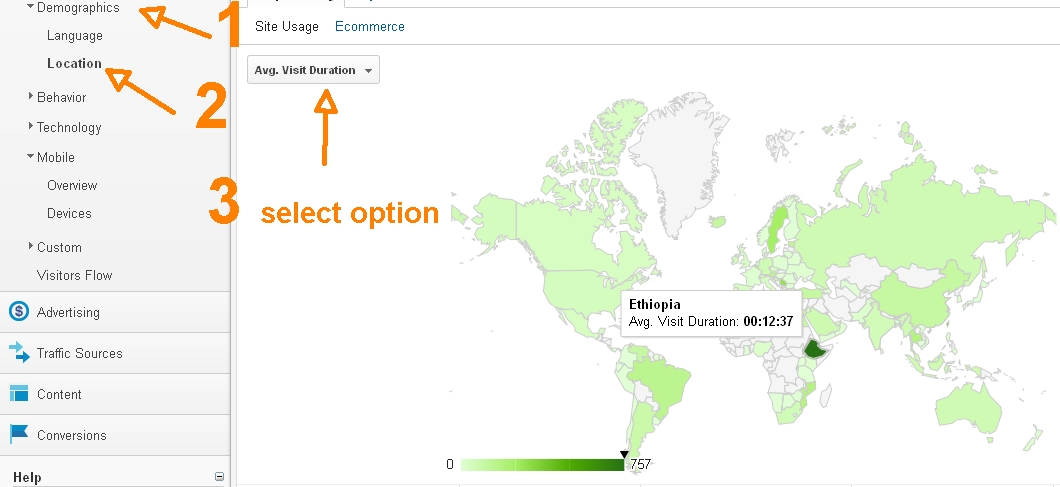
Figure 3: Google Analytics does the work for you
Now try it for yourself
If you want to experience a MOOC or cloud course for yourself, feel free to register for a free online course, or look at the files and information from the MOOC on mobile learning, called MobiMOOC, that ran from September 8 – 30, 2012. If you have a question concerning MOOCs or cloud courses, feel free to contact me.
(Editor’s Note: You can subscribe at mooc.ca to Stephen Downes’s daily MOOC Newsletter to watch for new MOOC announcements. Stephen also provides a list of open online course sources.)