


As mentioned in an earlier article , Frank Porter Graham Child Development Institute (FPG) utilizes an innovative blended learning strategy: we tailor onsite, instructor-led training by using data collected from eLearning. This allows onsite work to be more effective and efficient, enabling instructors to achieve more in less time.
Teaching in person, instructors develop relationships with learners. We get to know them, and we tailor our content and approach accordingly. But typically, a personalized and tailored approach is not what comes to mind when we hear or use the term “blended learning.” Too often, blended learning turns out to be a reduced real-time experience with digital add-ons, lowering rather than elevating the learning experience. In contrast, high-quality blended learning involving synchronous and asynchronous elements improves the effectiveness and efficiency of the overall instructional experience by leveraging the logistic conveniences of asynchronous instruction and the technical capabilities of learning technology to save time and money while enhancing the ability to personalize and tailor professional learning delivered synchronously.
This kind of high-quality blended synchronous and asynchronous learning requires a strategy that includes identifying learning objectives, designing learner experiences, and planning both the collection and use of learning activity data from asynchronous instruction. Pivotal to the blended learning strategy at FPG is a very effective data visualization tool we call the "traffic light" dashboard.
What is the traffic light dashboard?
With one row per learner, this visualization of data (Figure 1) is organized by learning objectives and details learners' strengths and weaknesses across the target skills as evidenced by their behavior throughout the asynchronous lesson. In the last row, a group evaluation is provided.
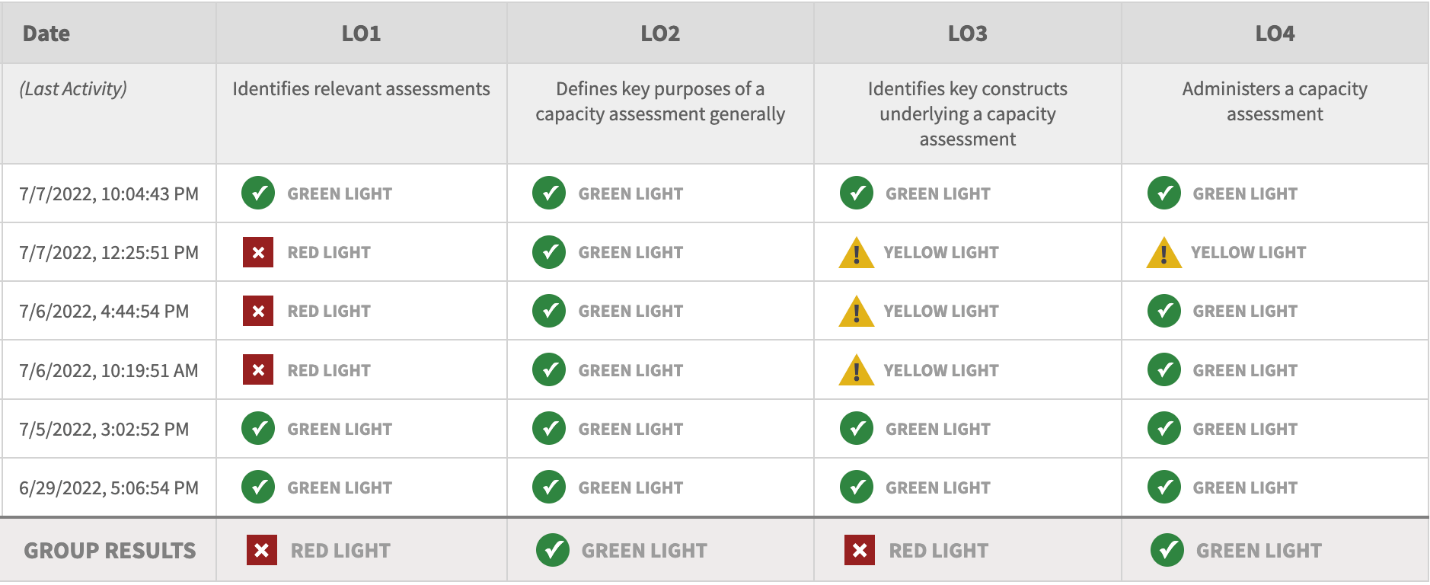
Figure 1: Traffic light dashboard (Note: names have been removed to allow anonymity)
Selecting any individual “traffic light” will produce a “drilldown” report (Figure 2) that provides greater detail of the behavior of that learner relevant to the learning objective:
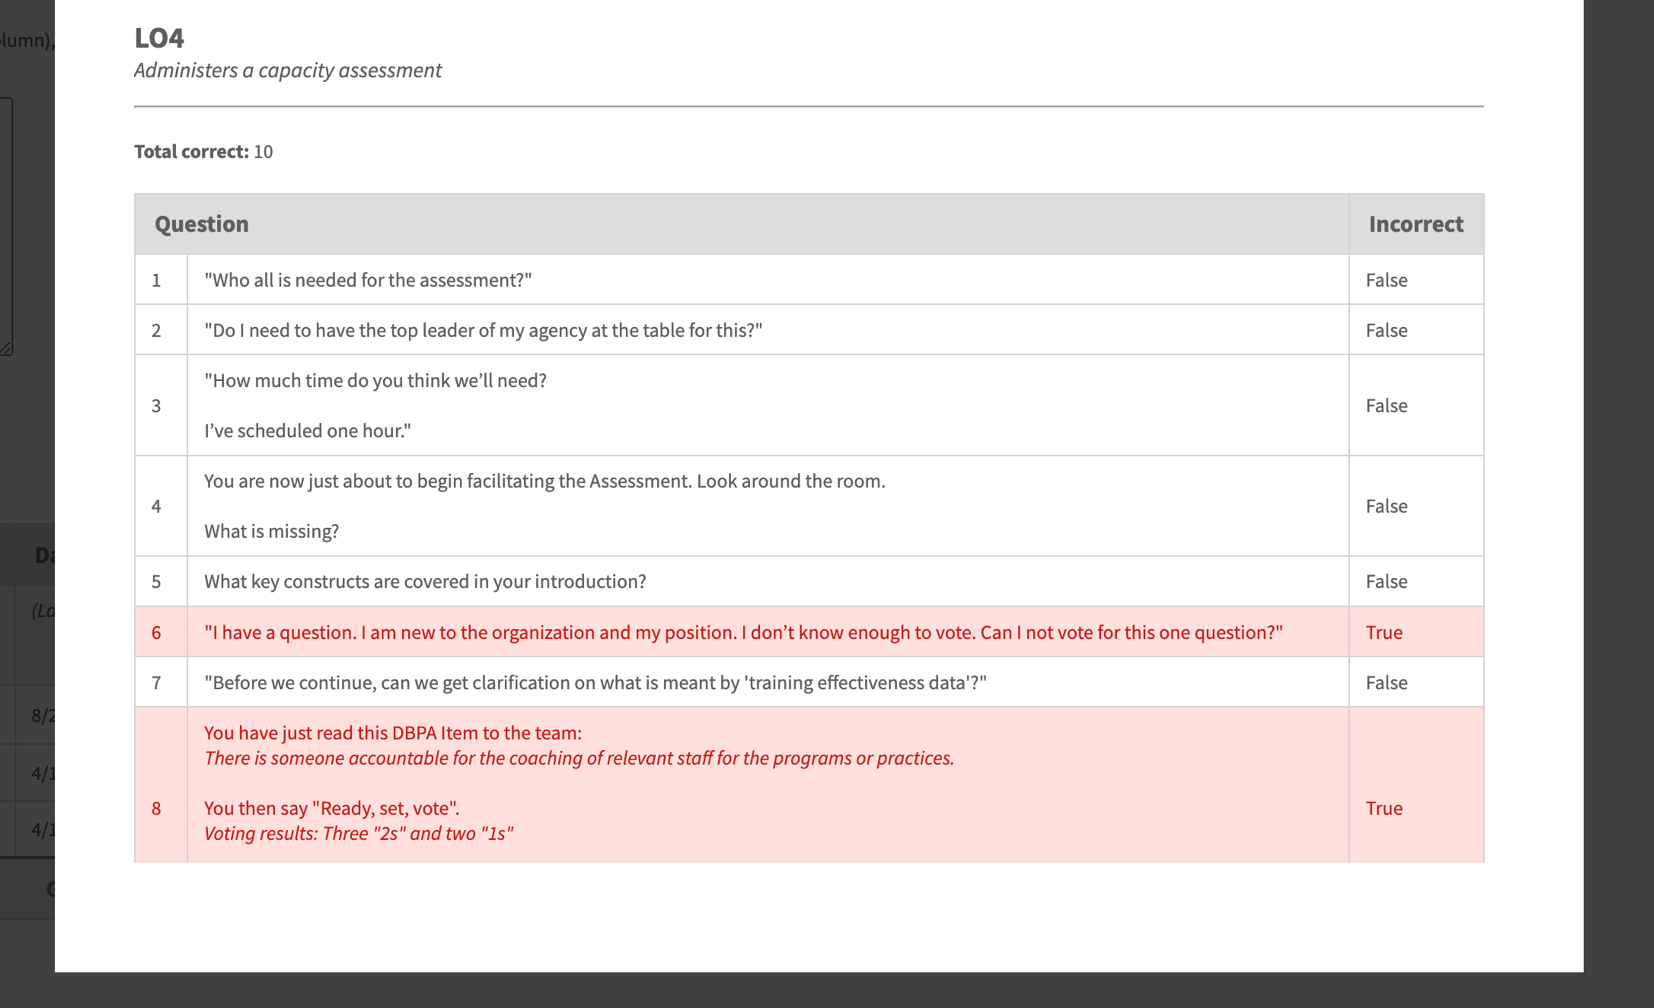
Figure 2: Drilldown report (Note: name has been removed to allow anonymity; report scrolls to show 14 questions)
The design of each drilldown (Figure 3) is determined by the information most useful to tailor follow-up instruction.
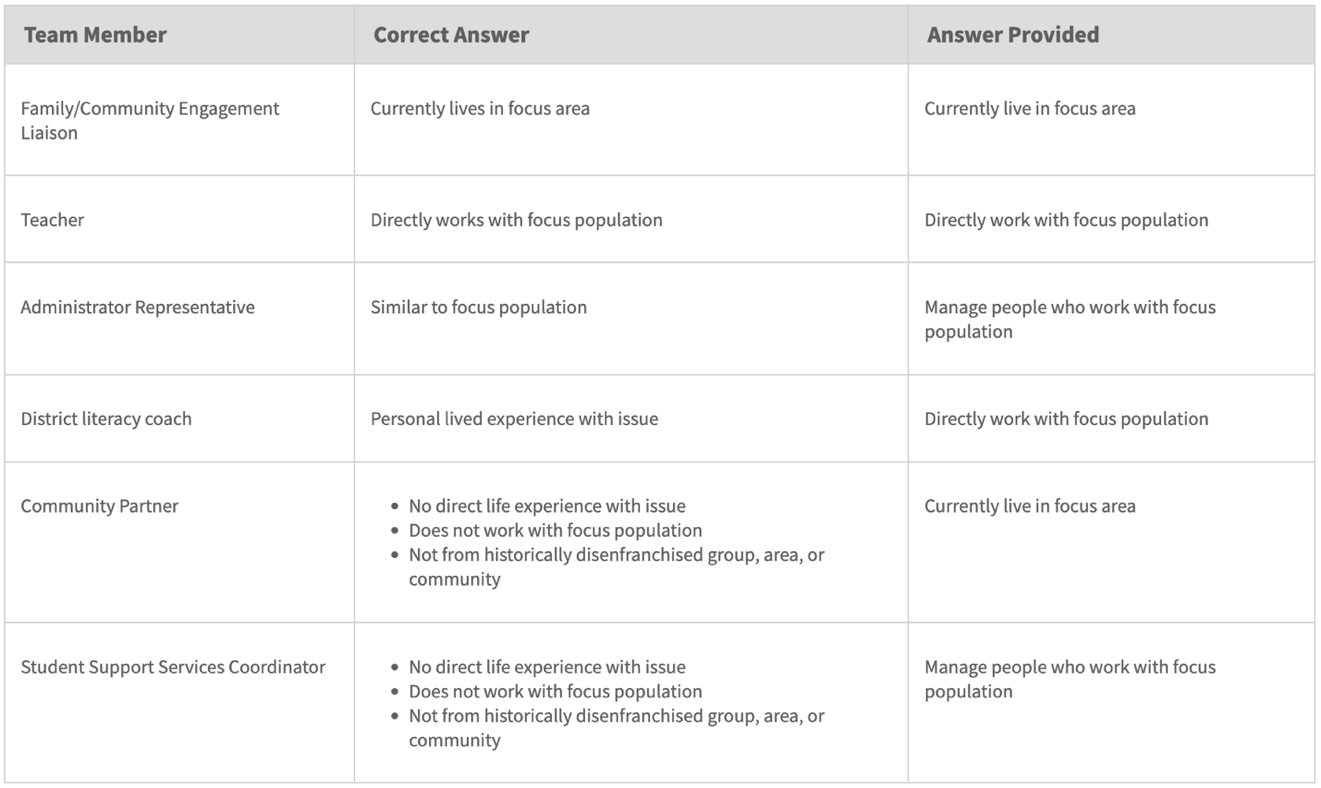
Figure 3: A drilldown report with a different design
The traffic light data visualization tool allows coaches and instructors to utilize robust, personalized data captured through asynchronous pre-work to personalize and tailor their synchronous support. It provides the kind of insight that allows them to make the best use of their time by skipping or truncating their coverage of strength areas so that they can extend to more advanced skills and/or review and further support areas of need. The result is more effective and efficient synchronous group work.
How can my team design a traffic light dashboard?
Collect data
If you intend to provide a visualization of learner activity data, you will first need to have a way to collect that data. At FPG, all our learner activity data is gathered in the form of xAPI statements reported to our learning record store (LRS); this type of learning ecosystem allows us the freedom to customize our learner interactions and the data they report. You don’t need an all xAPI/LRS ecosystem to gather learner activity data or create useful data visualizations, but you do need to plan both.
Plan your design while you plan your data collection
Organizing your learner experience design while you plan for data collection will help you plan experiences and interactions that will result in the data that you need. At FPG, we typically organize our asynchronous lessons around learning objectives, focusing on the experiences that are most likely to result in the desired behavior change. Most people learn best by doing, so we lean toward scenario-based narratives and realistic choices within virtual simulation. We produce detailed documentation to describe the data collected from the interactions in each asynchronous lesson we produce.
Plan your data collection while you plan your data visualization
The point of collecting data is to use it, so your data visualization plan will inform your data collection plan. Because your data collection plan will also inform your learner experience design, this means that all three elements should ideally be planned at the same time. Our data visualization plans are co-created with project SMEs and include learning objectives, the calculations that go into the “traffic light” evaluations, and the information that should be presented in the “drilldown” reports.
What does this process look like?
To create the traffic light dashboard illustrated above, we first defined our learning objectives. This asynchronous eLearning is designed to allow implementation teams to gain hands-on practice with appropriately selecting and administering capacity assessments, so we identified four objectives:
LO1: Identifies relevant assessments
LO2: Defines key purposes of a capacity assessment generally
LO3: Identifies key constructs underlying a capacity assessment
LO4: Administers a capacity assessment
With these learning objectives in mind, we designed learner experiences, data collection, and data visualization around each objective. For example, to achieve LO1, we asked learners to match their role with the assessment associated with their work. Capacity assessments differ by type and level of role, so we designed a branching experience. Learners were provided with information about assessments relevant to their field (education vs other). Afterward, they were asked to identify the level of their role and the assessments relevant to their work. They received personalized feedback depending on their role and choices. SMEs provided the content and feedback relevant to the assessments. (Figure 4)
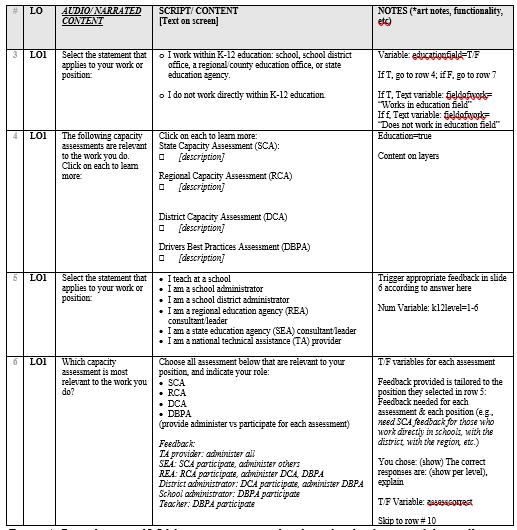
Figure 4: Partial script of LO1 learner experience detailing plan for design and data collection
After the script was created, the traffic light dashboard was planned. Here are the dashboard and drilldown plans for LO1 (Figures 5 and 6):
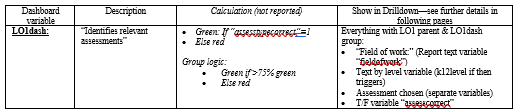
Figure 5: Traffic light dashboard plan for LO1
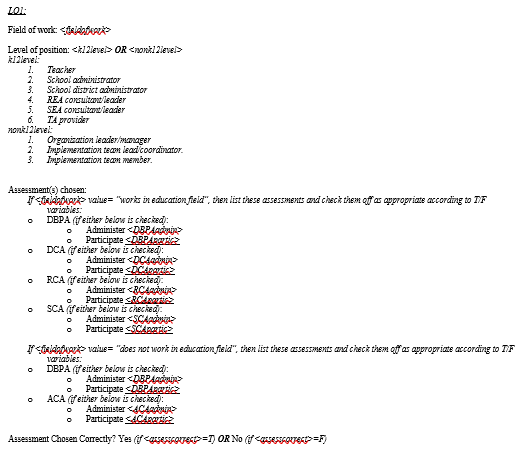
Figure 6: Drilldown dashboard plan for LO1
Here’s how the final drilldown report appears (Figure 7):
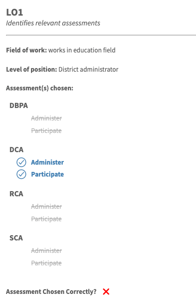
Figure 7: Drilldown visualization for LO1
The complexity of data planning depends on the learner experience, which depends on the nature of the learning objective. The learning experience designed for LO2, for example, consisted of the illustration of two fictional case examples (the “Stars Agency” and “Comet Agency”) and a brief follow-up question. Only two pieces of data were relevant: whether the learner got the question right, and how many times they tried (all incorrect answers were “try again”). Here are the script and data visualization plans for LO2 (Figures 8 and 9):
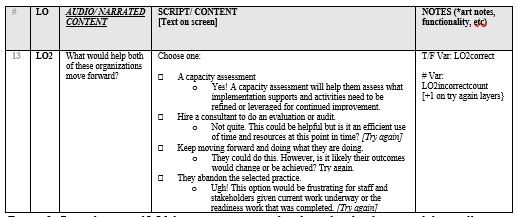
Figure 8: Partial script of LO2 learner experience detailing plan for design and data collection
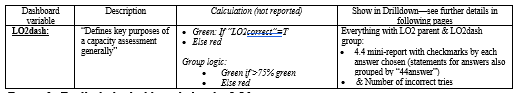
Figure 9: Traffic light dashboard plan for LO2
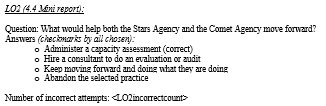
Figure 10: Drilldown dashboard plan for LO2
And here’s how it looks in practice (Figure 11):
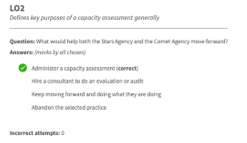
Figure 11: Drilldown visualization for LO2
Armed with this data, instructors have crucial line of sight into their learners’ individual needs, so they can plan to make the most efficient use of their synchronous support time.
We have found the “traffic light” dashboard to be an indispensable tool in our asynchronous/synchronous blended learning strategies. By collecting learner activity data from asynchronous prework and planning for data collection and visualization, you can design your own “traffic light” dashboard.
See for yourself how a data-forward blended learning approach leads to the increased effectiveness and efficiency of your organization’s synchronous instruction!
* Support for State Implementation & Scaling-up of Evidence-based Practices Center (SISEP) work came from cooperative Grant H326K17003-SISEP, funded by the Office of Special Education Programs (OSEP). OSEP is part of the US Department of Education, but the contents of this article do not necessarily reflect or represent the policy of that department.