People remember pictures. Several research studies have demonstrated this to be true (for example, see Grady, et al, in References). It’s especially true that, when a person sees something briefly, that individual is more likely to remember a picture than words or text.
Learners’ affinity for visual images provides a convincing reason for eLearning designers to incorporate lots of visuals into their content; infographics are a great way to do this. But it’s also true that learners are increasingly likely to access eLearning on a plethora of devices—including smartphones, which offer a small screen and thus a difficult canvas for infographics.
Meeting these conflicting goals—providing visual, engaging, and memorable content, and offering that content in ways that more learners can and will use—calls for a careful design strategy.
Designers need a three-pronged approach to creating successful eLearning infographics:
- Be judicious in choosing topics for infographics and other visuals, and have a clear goal in mind
- Use an appropriate format to meet that goal
- Apply responsive design and other best practices to ensure that the infographics are useful to mobile learners
Create compelling infographics
Since humans are so strongly wired to process visual information, infographics can be a powerful way to teach some concepts or present some information. According to Eugene Woo, founder of Visualize.me and Venngage, using more infographics can dramatically increase website traffic and engagement.
So, when should designers add an infographic—or even substitute an infographic for a text-heavy explanation? Woo recommends a goal-focused approach to creating infographics, and he uses what he calls the “ICCORE” method to identify the goal of the infographic. A clear understanding of the goal leads the designer to choose the best format. His question—“What do we want readers to achieve when they see the visual [the infographic]?”—can be answered with one of six possible goals, whose initial letters form ICCORE:
- Inform: Convey message or data point
- Compare: Compare parts or things
- Change: Show changes or trends over time or space
- Organize: Show groups, patterns, rank, or order
- Relationships: Show relationships between things
- Explore: Engage readers in exploring data and figuring out insights
Choose the most appropriate format
Understanding the goal of the infographic is essential to choosing the most appropriate format, Woo said. Some visual presentation formats, like charts and graphs, are ideal for comparing or showing relationships or presenting survey data. Venn diagrams, scatter plots, and word clouds also show relationships. To convey information, Woo suggests using large titles with pictograms and labels; maps or timelines compare data or illustrate change over time. Use a pyramid to show hierarchy; a bubble chart can illuminate relative size or impact. A series of panels can demonstrate the steps of a simple process, and a labeled diagram can teach the parts of a whole while showing learners how those parts fit together. To get learners to explore a topic, Woo suggests interactive maps or diagrams or “layered” graphics that allow learners to drill down—for instance, presenting national data on the top layer, then state, then county or city data, as the learner clicks on deeper layers.
You can present the same data in different ways, but each sends learners a different message or emphasizes different aspects of the data. This series of infographics on military spending from The Guardian shows how to use a single data set to focus on several different details. For example, if two populations share some characteristics but differ on others, a Venn diagram can emphasize areas of overlap, while a chart is useful to highlight contrasts or areas of disagreement.
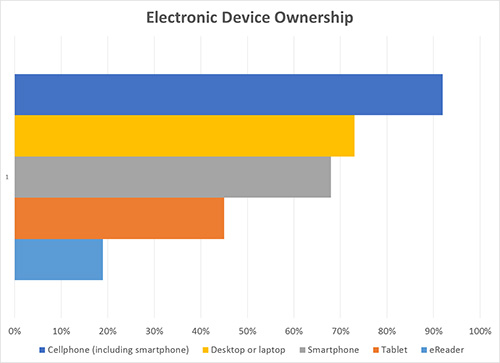
The bar chart in Figure 1 compares the number of US adults who own each type of electronic device. (Data from Pew Research Center, “Technology Device Ownership: 2015”; see References.)

Figure 1: Ownership of electronic devices
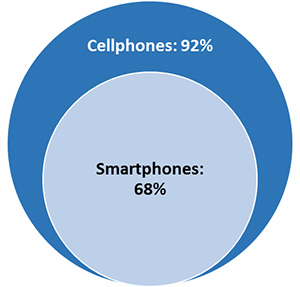
In Figure 2, the stacked Venn diagram shows the relationship between smartphone ownership and cellphone ownership. Smartphone owners are a subset of cellphone owners; that is, every smartphone is also a cellphone, but some adults have cellphones that are not smartphones.

Figure 2: Smartphone ownership as a subset of cellphone ownership
Design for mobile
Learners are bombarded with information and often have to absorb new material quickly. This is an area where visuals are particularly helpful. A neuroimaging study tested participants on images and text that they saw quickly, without the opportunity to think about it or relate it to other knowledge; they remembered pictures better than they remembered words. Thus mobile environments—more conducive to performance support, reference materials, or “job aids” that learners reference on the go—could be an area where infographics would be useful to learners.
When seeking to present information visually while also ensuring that eLearning is mobile-friendly, designers must acknowledge that not all infographics will work on mobile. That said, “mobile-friendly infographic” is not an oxymoron; in fact, careful design can result in effective, engaging infographics that work on many platforms, including smartphones.
All infographics, for any medium, start with the basic elements: a great topic, solid data, and strong visuals. When designers create responsive designs, their infographics will adjust for display on any platform without forcing learners to zoom or scroll. But, responsive design or not, designers creating infographics for mobile devices must pay extra attention to details, such as:
- Grid-based modular design: Anticipate mobile use by creating a design in blocks that can appear horizontally or stack vertically—when learners view the infographic on a smartphone, they will view the blocks in sequence. It might help to think of each block as a panel, as in a comic strip. Design each block to be appealing and legible at the size of a typical smartphone screen; many templates exist to help designers get the correct size and proportion. Remember that each block is, essentially, a separate infographic that will scale as a single unit; elements within a block will not be resized individually or repositioned for display on a mobile screen.
- Minimal text: Using templates or mock-ups designed for smartphones can help test the legibility of text at small sizes. A responsively designed infographic will scale—as a block—to fit the display; if this results in six-point text, the infographic is not mobile-friendly. Limit the number of words per screen, and add more blocks or panels if needed.
- Appropriate fonts: Use no more than two typefaces, and choose clear, simple, scalable fonts that complement each other. Fonts with serifs or other decorative elements are hard to read in small sizes.
- Icons: Add icons to enhance text—or replace text with icons in scaled-down versions of an infographic. Building the design so that some elements and text are removed when the display shrinks makes an infographic more mobile-friendly.
- Color: Choose colors wisely; the combination and contrast of colors affects learners’ comprehension. Color and contrast can strengthen the visual impact; changing one line of a chart to a contrasting color effectively highlights important information, for example.
- Breathing room: Don’t crowd the elements; leave space in the infographic and around the margins. Woo recommends at least 30 percent “negative” or uncluttered space.
A designer who struggles with one or more of these guidelines might rethink the approach: Can the infographic be used to represent a smaller part of the data? Can multiple panels or infographics be used? Is this concept better taught using text or a different format, like flash cards or a game? Is it possible to swap the infographic for text or a different set of visuals for mobile learners?
The bottom line is that the eLearning is only effective if learners use it. And, while more learners want to access eLearning on their smartphones, they are unlikely to engage with content that forces them to squint and scroll to decipher it.
References
Anderson, Monica. “Technology Device Ownership: 2015.” Pew Research Center. 29 October 2015.
Grady, Cheryl L., Anthony R. McIntosh, M. Natasha Rajah, and Fergus I.M. Craik. “Neural correlates of the episodic encoding of pictures and words.” Proceedings of the National Academy of Sciences, Vol. 95, No. 5. April 1998.
McCandless, David. “Information is beautiful: war games.” The Guardian. 1 April 2010.
Woods, Bianca. “Telling Your Story with Infographics.” Learning Solutions 2014 Conference & Expo. 20 March 2014.


