


The Experience API (xAPI) allows us to collect data about any type of learning experience or activity, but does that mean we should? Should we generate massive amounts of xAPI data for every possible type of interaction and then expect to make sense of it all later? This approach can be costly in terms of data storage, but also in terms of your time. It can be very labor-intensive to sift through all the noisy data, especially if it wasn’t modeled thoughtfully. It can be like trying to find a needle in a haystack if you don’t carefully plan and think about the data you should be collecting before your learning content is designed. The quality and veracity of the xAPI data generated by your learning content are also extremely important. When it comes to xAPI, we should really try to prioritize quality over quantity.
What is meant by the title, “Don’t Just Give Me All the Data?” Well, given the focus on big data, machine learning, and artificial intelligence in recent years, you’ve likely heard the phrase, “Give Me All the Data.” This implies that in our world of data abundance, we should just collect as much data as possible and then we’ll easily figure out how to analyze it later. My professional experience with real-world implementations of xAPI has led me to propose the opposite approach. Don’t just give me all the data! Instead, as instructional designers, learning engineers, and evaluators, we should be very intentional and pragmatic about what data is collected.
If you fail to plan, you are planning to fail
Throughout my career in learning & development (L&D), I’ve participated in or seen many projects where learning content was delivered to a learning management system (LMS) without any evaluation of whether it was effective or if anything in it could be improved based on analyzing the outcome data. Many clients would typically ask for basic reports such as total completions and scores but never really thought to analyze whether the learning content was making a real impact. This was often the case with Sharable Content Object Reference Model (SCORM) content because many LMSs didn’t have very useful reports or metrics out-of-the-box (albeit SCORM actually did allow for tracking quite a bit of information beyond just completions and scores). Another historical problem with relying on LMS data for evaluation was that the data was often stuck in the LMS. It was either impossible or extremely difficult to export to other reporting tools for deeper analysis. This is one of the many reasons why xAPI was created and designed to solve. Unfortunately, many development efforts often start with only a basic understanding of xAPI and rush into implementing it without thinking about how the data will be evaluated later on. This is likely because xAPI is supported by many authoring tools and its potential often excites us immediately, not to mention how much easier it is to understand and implement than SCORM.
In many new xAPI-based learning solutions or projects I’ve seen, the stakeholders commonly start off with focusing on a list of verbs they think they might use. Sound familiar? xAPI is not just about the verbs! A more strategic approach would be to start with the end in mind, which is evaluation. How will you evaluate the success and effectiveness of the learning (or training) solution? If you think about it, we really shouldn’t identify any of the xAPI data that will be collected until there is some careful thought and planning put into the broader evaluation and reporting strategy. The more successful xAPI-based projects have a strategy. An excellent example is the work led by Wendy Morgan of the Frank Porter Graham Child Development Institute (FPG) at the University of North Carolina, Chapel Hill. Delineating clear instructional strategy while developing learner experiences resulted in quality data collection and creative dashboard designs.
Evaluation provides the feedback loop necessary to determine whether the learning (or training) solution is effective at doing the job it was designed to do. Establishing an evaluation strategy is probably most widely known by instructional designers as the “E” part of the Analysis - Design - Development - Implementation - Evaluation (ADDIE) model. From my observations, it is often the most neglected part of the ADDIE model (or PADDIE+M for those that like to include the planning and maintenance phases…kudos to those who do)! What is meant by my comment about neglect? Well, in many instructional design strategies (insert your favorite modern, agile, rapid prototyping approach here), evaluation is often only assumed to be something you do during all project phases to collect feedback and improve the product being developed. Measuring and evaluating the effectiveness of your learning (or training) solution, in general, should definitely be a continuous process. It isn’t a “one and done” event. The claim I’m making is that the original intent of the evaluation phase is often forgotten or commonly treated as an afterthought. The original purpose of having a dedicated evaluation phase is to execute an evaluation strategy, which should be discussed and determined early on during the planning, analysis, and design phases so that we can better analyze the effectiveness and efficiency of the learning solution. A lack of planning for evaluation, coupled with a heavy dependence on the default xAPI output from some authoring tools, has subsequently resulted in lots of uninspired and disappointing data analyses for many organizations.
Identifying the reasons for measuring
Evaluation models such as the Kirkpatrick Model (KM) are useful for developing a high-level strategy for evaluating learning (or training) across different programs or for combining different types of assessments and evaluations of a single program. Since the KM Levels 1 - 4 were historically presented and explained numerically, many organizations often hastily start with Level 1 (Reaction). It is no surprise why so many KM-based evaluation efforts are strongly focused on KM Level 1 and formative surveys. Humans naturally want to follow something that’s ordered. However, the Kirkpatrick Model is not required (or intended) to be executed in the same order it was originally presented. In recent decades, clarifications and improvements to the Kirkpatrick Model have recommended starting with Level 4 (Results) during the planning phase to first define the broader program objectives and outcomes, so they will influence and shape what is measured for the other Levels.
The Philips Return on Investment (ROI) Model was introduced as an expansion and improvement to the Kirkpatrick Model. The Philips ROI Model adds an optional Level 5 (ROI) to the Kirkpatrick Model for conducting a cost-benefit analysis and determining the operational cost or value of training programs. Most importantly, the Philips ROI Model revised the Kirkpatrick Model by recommending that measures related to impact in Level 4 (Results) can and probably should be isolated from effectiveness measures. In other words, Phillips ROI Model contends that only focusing on the impact of the learning (or training) solution and ignoring other factors is controversial and not always practical or possible. This makes sense because factors other than the learning (or training) solution often contribute to delivering the outcomes. While several organizations have adopted the Kirkpatrick Model as their foundational approach for learning (or training) effectiveness evaluation, more specific details must be ironed out and defined at each of the KM Levels to answer how training effectiveness will be measured, and exactly what data should actually be collected to support those measures.
In recent years, I’ve been more focused on how we (the L&D community) can fill in the gaps in traditional instructional design practices and evaluation models to generate better xAPI data. While reading Learning Analytics: Using Talent Data to Improve Business Outcomes and Measurement Demystified: Creating Your L&D Measurement, Analytics, and Reporting Strategy, I was introduced to the Talent Development Reporting Principles (TDRp) Framework. This framework is a marvelous concept that builds off the Kirkpatrick and Philips ROI models to more clearly articulate and categorize the different types of measurement. The TDRp Framework was developed by a group of more than 30 thought leaders from the L&D field. The idea for the framework came from the group’s aspiration to create standard measures similar to the widely adopted metrics and reporting standards of the financial world (e.g., profit margin, burn rate, balance sheets, cash flow statements, etc.), but for measuring or reporting on the impact of learning and performance instead. Undoubtedly, our industry will benefit from this same type of approach of standardizing common learning and performance measures and reports.
The TDRp Framework also provides a taxonomy to help organizations think more clearly about the reasons to measure, and how to use them for reporting and evaluation. It is also helpful in augmenting the Kirkpatrick Model (or other evaluation models) because it can help organizations answer “why” they should measure by organizing the reasons into four purposeful categories. According to the TDRp Framework, the reasons to measure are:
- To Inform – sharing activity, identifying trends, answering questions, and identifying opportunities for improvement
- To Monitor – assessing whether a particular measure is meeting the threshold; and how the results compare to a benchmark
- To Analyze or Evaluate – determining the effectiveness of the training and demonstrating its value
- To Manage – actively managing the program or training to deliver results
Many organizations might identify with all these reasons for measuring. After determining the exact reasons for measuring, it will become much easier for organizations to develop the actual reporting requirements and measures.
Establishing the reporting requirements
Reporting requirements typically drive and clarify what exactly should be measured. As creators of learning (or training) solutions, we should determine whether the data will support our organization’s reporting goals. For example, are the reporting goals informing and aligning with the evaluation strategy? We should think about the reporting goals up front and what types of things we should measure to support those reporting goals before we try to design or generate our first xAPI statement. In order to figure out those goals for reporting, we also need to think about who the leaders or decision-makers are for evaluating the reports later on. Is it a customer, a chief learning officer (CLO), or a department head? Regardless, you’ll want to get decision-maker input to determine the reporting goals. Establishing reporting goals will also make it easier to support design-related tasks, such as aligning the learning objectives and the reports themselves to the broader evaluation strategy.
Reports aid in analyzing and evaluating learning (or training) effectiveness and performance against the predetermined metrics and communicate this information in easily understood visual displays of the data. Data collected via xAPI can be displayed in a variety of different formats, such as static data exports, scorecards, tables, graphs, or dashboards. Custom reports using these formats can also be created to highlight the relationships between key performance indicators (KPIs), such as comparison of pretest and posttest results. A KPI is any measure that reflects how well an organization is achieving its reporting goals, which is important for setting benchmarks to measure and evaluate performance against the goals, and for establishing repeatable reporting metrics. KPIs can be tracked and reported on a regular basis to support the broader goal of providing a feedback loop. The frequency of data collection and reporting is also something that should be considered when identifying the KPIs and broader reporting requirements.
Understanding the types of measures
Establishing reporting requirements up front is extremely valuable for identifying what should be measured. In the absence of specific, well-defined reporting requirements, some initial measures could at least be identified and documented. The TDRp Framework delineates measures into three categories:
- Efficiency Measures – provide insights into the quantity of training delivered, and measure things such as volume (e.g., number of users, activities, courses, hours), utilization, and reach
- Effectiveness Measures – provide insights into the quality of the program or training products and measures the KM Levels (e.g., Reaction, Learning, Behavior)
- Impact/Outcome Measures – demonstrate the impact of learning (or training) on operational or business goals
A strategy that includes both efficiency and effectiveness measures is critical for embracing a balanced, holistic evaluation of learning and performance. Measuring efficiency alone is not actionable enough and can lead to unintended consequences if the feedback and decisions are based only on quantity and do not also consider quality. Measuring effectiveness alone is also an incomplete strategy and could unintentionally shed a negative light on the quality of the learning (or training) solution when the problem might actually stem from other factors (e.g., access, utilization, equipment, funding, resources, etc.). As discussed earlier, in many cases KM Level 4 (Results) should be isolated from effectiveness measures.
Unfortunately, decision-makers often do not know what reports they want to see or what should be measured. This problem is common in most xAPI implementations I’ve seen, which is the primary reason for writing this article and proposing this approach as a starting point. The target audience is not limited to just decision-makers. Anyone attempting to implement xAPI could really benefit from a list of example measures and reports to choose from, especially since we have been historically preconditioned to think only about basic reporting requirements, such as completion data and scores.
Aligning the reporting goals and measures with the xAPI data collection requirements
In addition to identifying the appropriate measures and reporting requirements, an understanding of how xAPI data can accurately support them is of paramount importance. While I respectfully credit the TDRp Framework for positively influencing my thinking, I still had a burning motivation to answer the question: “How can I help others understand the importance of generating quality xAPI data in support of reporting and evaluation?” We need a tool for thinking about how to connect the reporting requirements and measures to the xAPI data collection requirements.
Data collection requirements for xAPI-based content are often formally defined and documented in xAPI Profiles. Profiles help organizations establish a common vocabulary and semantics, and determine exactly what data should be collected to meet specific measurement, reporting and analytic requirements. A profile is essentially the “blueprint” for implementing xAPI consistently in a specific context. There are several xAPI Profiles already widely available for reuse from the Advanced Distributed Learning (ADL) Initiative at https://profiles.adlnet.gov. It is not required to adopt or fully reuse an entire profile. In fact, only specific parts of a profile can be reused, depending on your data collection requirements. In some cases, you might only need to query some of the data in an xAPI Statement and will not require reusing an entire profile for your project.
Aligning your organization’s reporting goals and specific measures with xAPI requires time up front for careful planning, but it can ultimately save you valuable time, and you’ll definitely have more useful data to analyze later on. An approach that I’ve found extremely useful is to organize and align your reporting goals with corresponding measures, feedback loops, reporting options, and xAPI data collection requirements. Table 1 below provides a description of each of these proposed attributes.
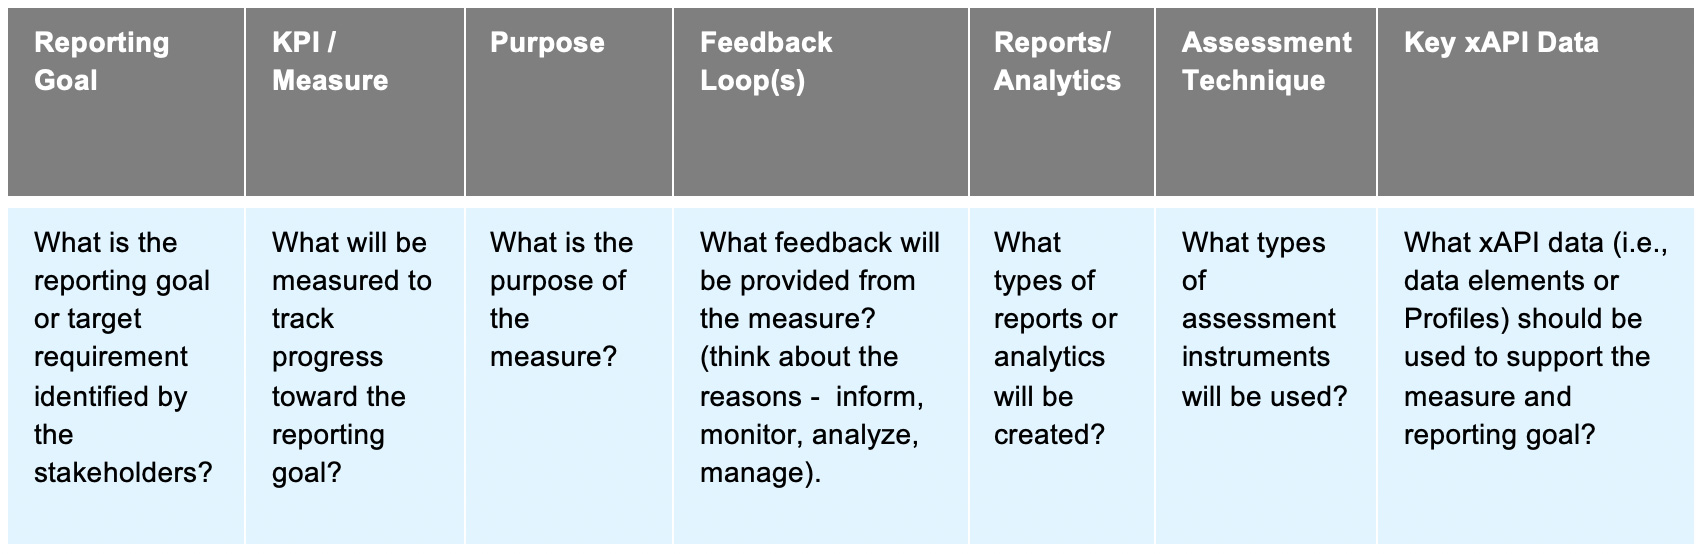
Table 1: Aligning reporting goals and measures with xAPI
Effectiveness measures
Effectiveness measures are focused on providing metrics related to the assessment of learning and performance. The reports that come from effectiveness measures may be used for improving the quality of a learning (or training) program as a whole or the individual solutions supporting the program. Effectiveness measures will ultimately drive what data are collected in surveys and summative assessments (both knowledge-based and performance-based). Since surveys are self-reported instruments, evaluators have traditionally questioned whether they can solely rely on the personal opinions or subjective results of how much was actually learned or improved. Therefore, effectiveness should be primarily measured with objective (or empirical) instruments, such as criterion-referenced and norm-referenced tests. Criterion-referenced tests can be used to compare a learner’s test results against a predetermined standard, goal, or other criterion regardless of how other learners performed on the test. Norm-referenced tests can be used to compare a learner’s test results against how other learners performed.
The example reporting goals and effectiveness measures provided in Table 2 below are focused on KM Level 2 (Learning). In addition to common testing scenarios, we could also conduct an observational assessment to measure KM Level 2 (Learning), where the instructor would verify the learner’s performance. For example, the instructor could complete a survey about the learner’s performance on a classroom lab exercise, drill, or hands-on skill activity. We can also measure KM Level 2 (Learning) via a scenario-based performance assessment, which could include additional context and resources needed for responding to the assessment questions (e.g., simulated virtual environment, equipment, interfaces, devices, tools, manuals, schematics, or workflows). Scenario-based performance assessments are typically used in high-stakes situations when measuring decision-making and problem-solving skills are required.
*click on the table below to open it in a new screen where it can be enlarged for easier viewing
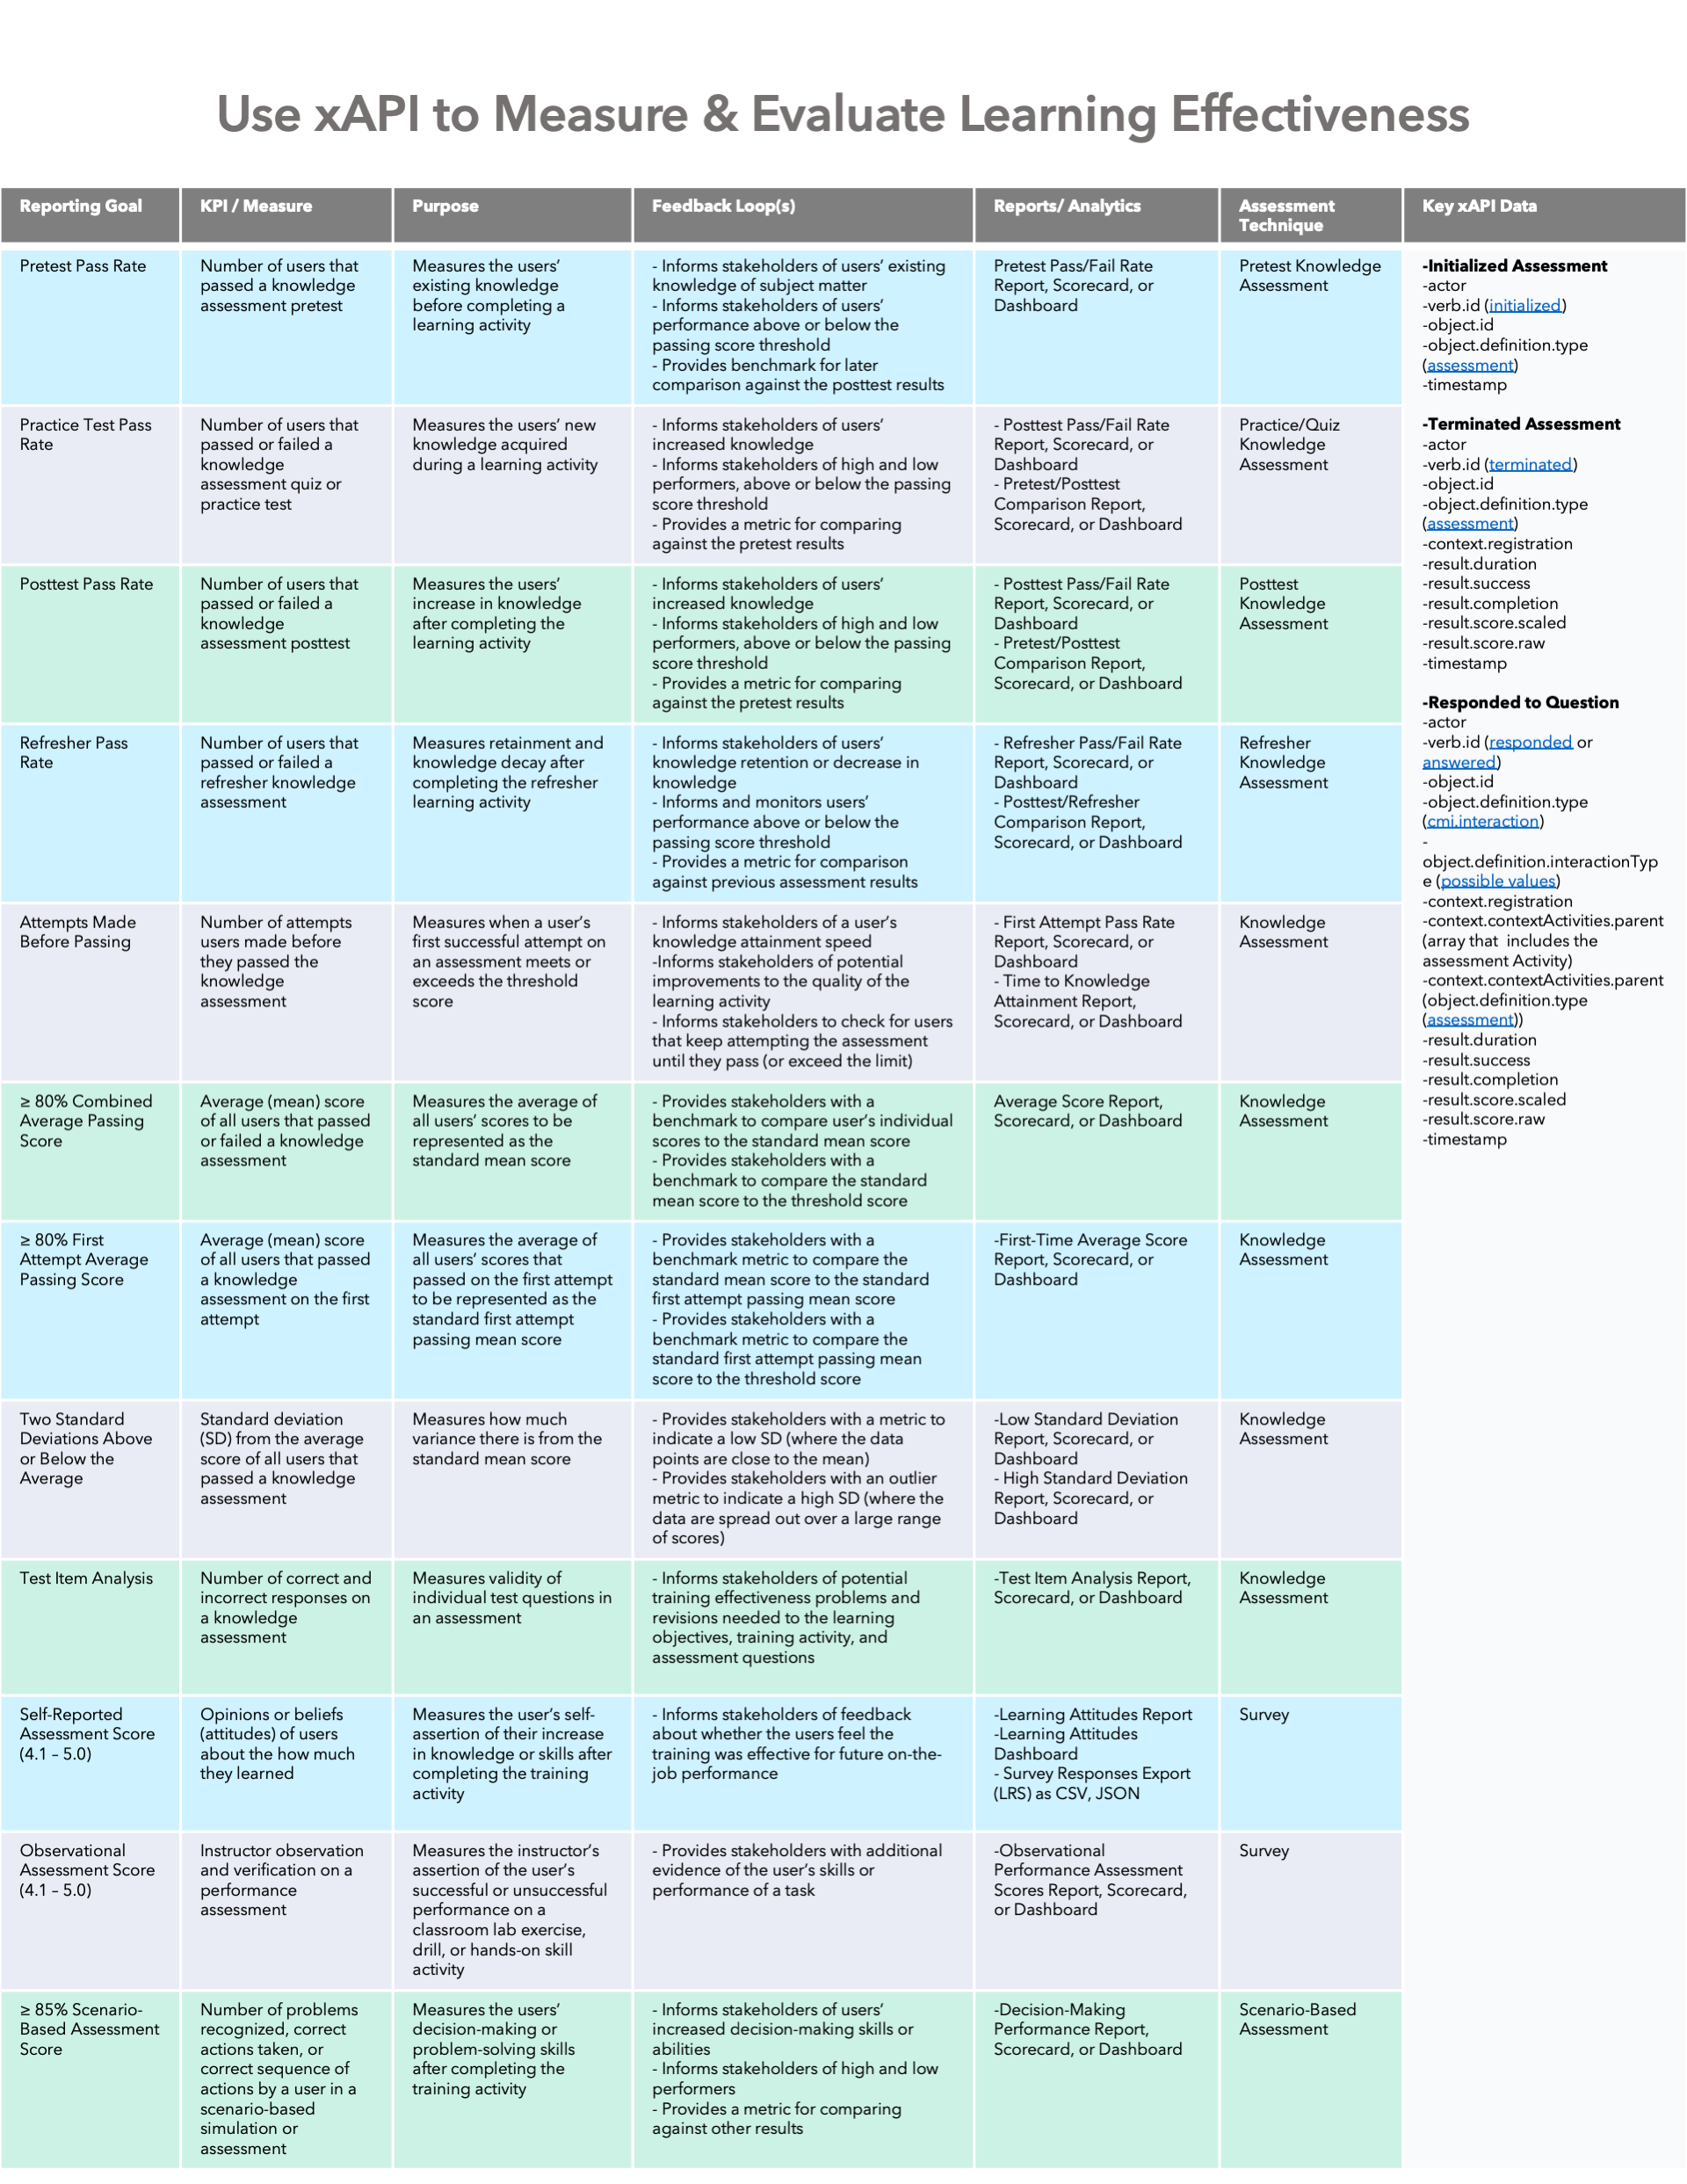 Table 2: Effectiveness measures
Efficiency measures
Efficiency measures focus on providing metrics related to users, activity, and time spent in the learning content or system. Efficiency measures are typically focused on quantity (how much) and duration (how long) and can also include data related to understanding access, volume, and reach. Measuring quantity and duration is the perfect starting point for most organizations and are probably the most reported efficiency measures. In Measurement Demystified, the authors describe these types of measures as “Level 0” since they do not directly support evaluating the effectiveness of the learning (or training) solution and do not have any form of assessment. Measuring and evaluating efficiency with xAPI can provide for additional analysis and insights, especially when combined with data from other measures (i.e., effectiveness) and sources (e.g., systems, development costs, user demographics, HR data, etc.).
In addition to efficiency measures related to attempts, completions, and time spent in a course, measuring the efficiency of performance support solutions will enable a feedback loop that allows stakeholders to monitor access and usage. This approach can help identify when users are having trouble locating the right content when they need it (to perform), or even if they are having trouble finding the content at all. Organizations will be able to best fine-tune their learning (or training) solutions for maximum impact when they are also informed by efficiency metrics that identify at a granular level whether specific content is being discovered, interacted with, understood and repeatedly accessed.
Table 3 below is organized by efficiency measures appropriate for two example content modalities (courses and performance support). Unlike the previous table of example effectiveness measures, this table is organized by content modalities since the corresponding efficiency measures are focused on capturing metrics such as quantity and duration for each modality. The efficiency measure itself is what will be reported on.
*click on the table below to open it in a new screen where it can be enlarged for easier viewing
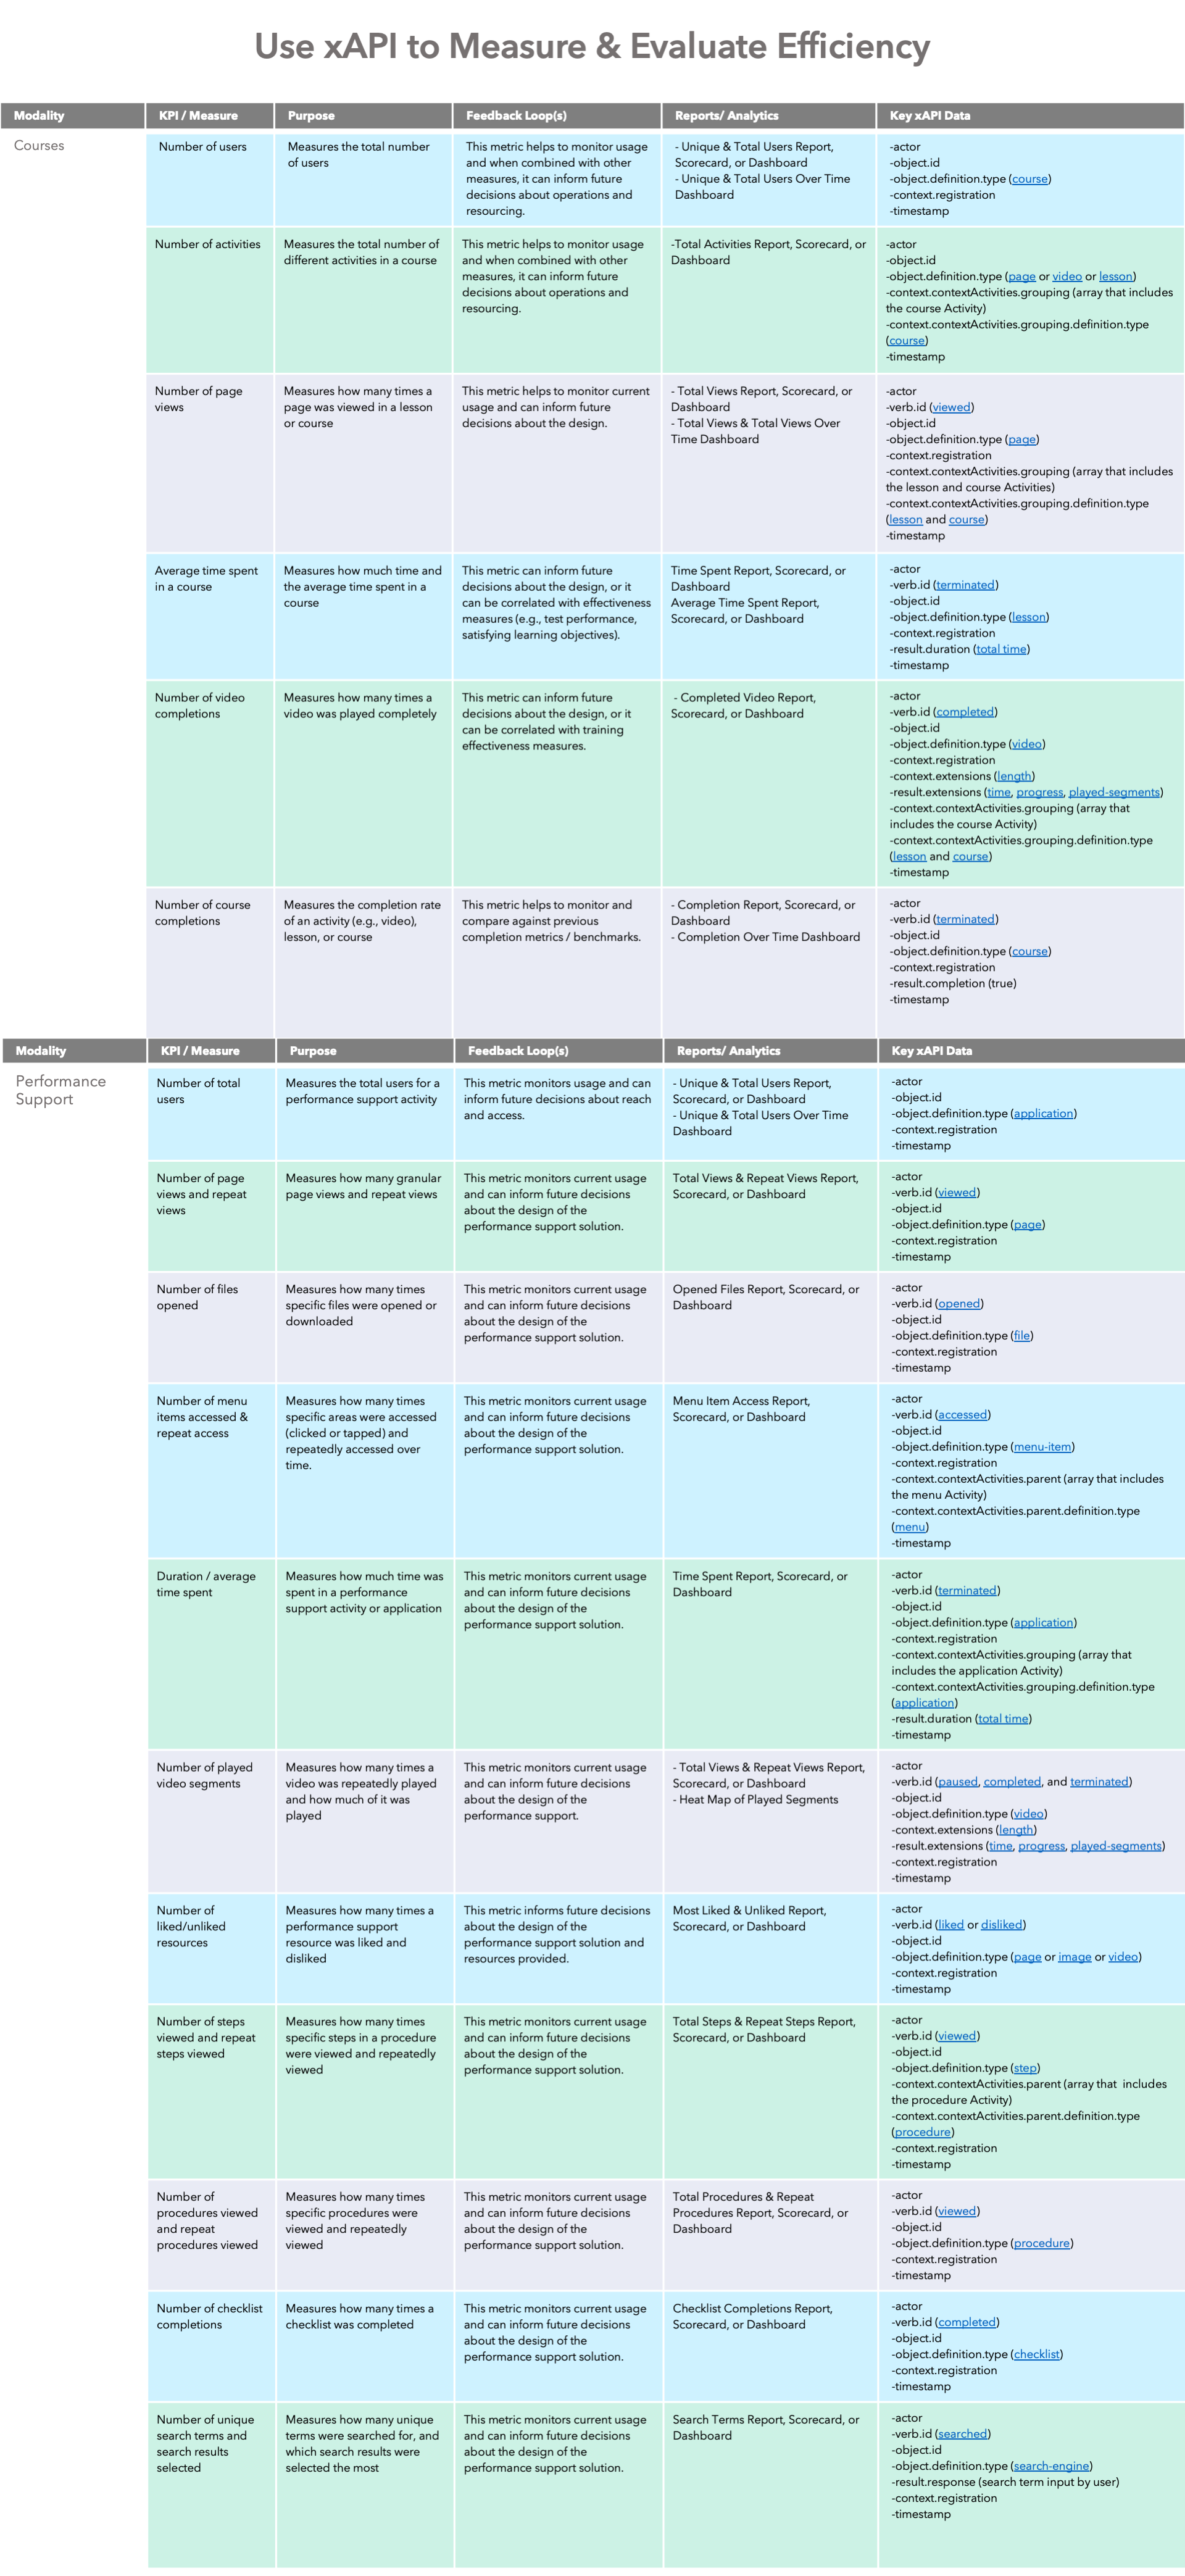 Table 3: Efficiency Measures
Conclusion
In summary, don’t just give me all the data! Give me the data I need! Focusing on measures of efficiency and effectiveness may provide a more practical start when implementing xAPI and figuring out what you really need. These examples and measures are intended to serve as a starting point to help organizations begin to think about how they can identify simple measures and leverage xAPI to enhance and support their learning (or training) evaluation strategies. After all, that is why we should be using xAPI in the first place, right? To evaluate learning outcomes and make sure they are improving performance or making an impact on our business or mission objectives.